Volatility. Trading based on index.

Without understanding what volatility is and how to apply it to trading based on the index, there is no point in delving into the issue. We have 4 background information points, however, this one is placed first for a reason.
1. Definitions.
Volatility is variability. In the context of the financial market, this indicator shows the variability of the price of any assets.
In practical terms:
Volatility - the difference from low to high of a candle in %. It can be calculated in both absolute values and in a different way altogether, but we will consider this method. This indicator should be the basis for certain calculations that enhance the profitability of algorithms in trading based on the index.
We will be interested in a subproduct of volatility:
"Average volatility value for a period." That is, a simple moving average, placed on the chart inside the intraday (daily candle) volatility (chart of the variation of the instrument from low to high of the candle in %). Based on this subgraph, a more effective selection of securities with similar volatility to the index compared to "all to the index" is possible.
We will also be interested in another subproduct of volatility:
"Average volatility value for TWO periods." That is, two simple moving averages, plotted on the volatility chart. This will be needed for the following indicator:
"Chart of the position of TWO average volatility values of different lengths relative to each other." A column chart taking values from 1 to 4, indicating the stage at which the volatility is currently in. Rising, falling, unchanged, etc.
2. Volatility on the chart.
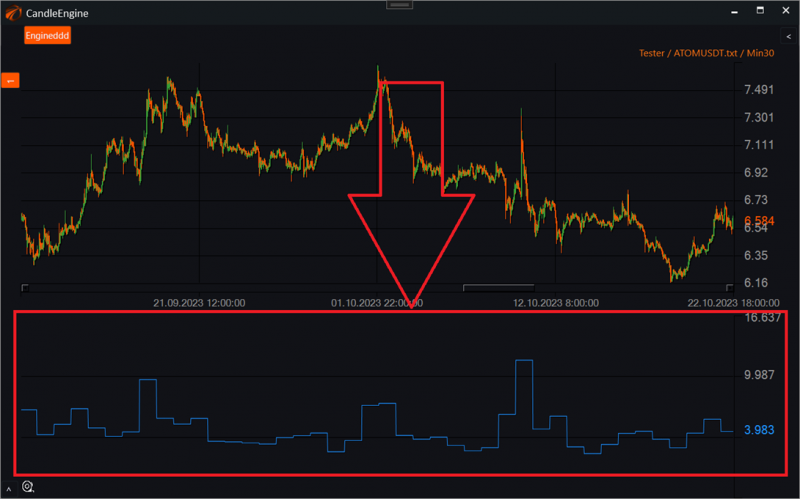
VolatilityBase Indicator.
Link in the project: https://github.com/AlexWan/OsEngine
Period settings: Day / Week / Candle. Attention to DAY.
Variable type settings: Percent / Absolute. Attention to Percent.
Where it can be applied: in the calculation of other indicators. These are the basic data on which each indicator described below will rely.
3. Average volatility value for a period on the chart.

VolatilityAverage Indicator.
Link in the project: https://github.com/AlexWan/OsEngine
Where it can be applied: for comparison between the index and the instrument in single-legged index arbitrage.
4. Chart of two average values of volatility of different lengths.

VolatilityAverageTwice Indicator.
Link in the project: https://github.com/AlexWan/OsEngine
Where it can be applied: data from this indicator is used to calculate the volatility stage according to the VolatilityStagesAW indicator in "2" mode.
5. Chart of two average values of volatility of different lengths and a channel offset from the long average.

VolatilityAverageChannel Indicator.
Link in the project: https://github.com/AlexWan/OsEngine
Where it can be applied: data from this indicator is used to calculate the stage of volatility according to the VolatilityStagesAW indicator in "3" and "4" modes.
6. Indicator of volatility stages.
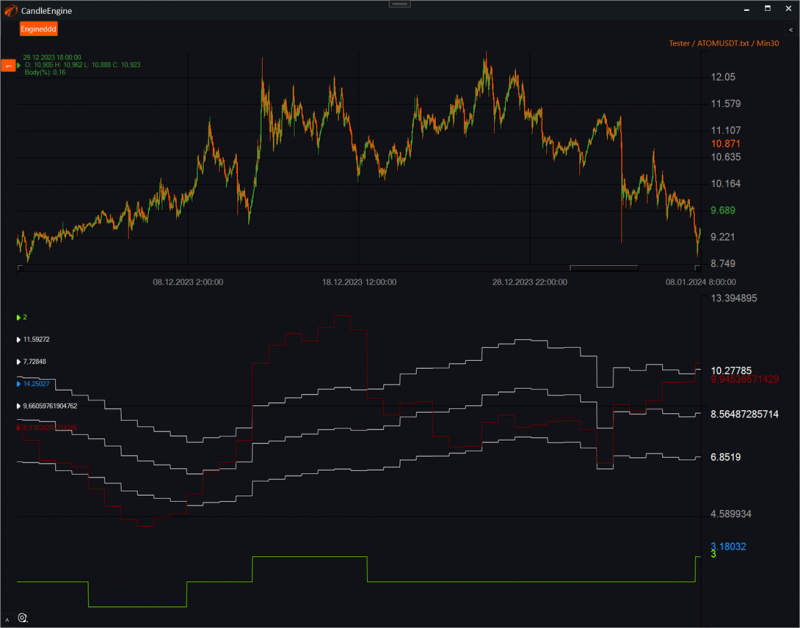
VolatilityStagesAW Indicator.
Link in the project: https://github.com/AlexWan/OsEngine
Where it can be applied:
1. In trend trading to distribute parameters under different volatility stages. In this case, optimization should also be conducted separately for different stages. This will be added to the trend book someday.
2. In index trading to distribute parameters under different stages of index volatility. To change the type of groupings of instruments that are traded against it. To lock certain types of entries in separate volatility stages.
3. You will have to get used to the indicator...
Settings:

1. Volatility stages regime. Modes of distributing stages that the indicator will show:
- Mode 2:
1. Fast moving average above the slow-moving average - stage 2.
2. Fast moving average below the slow-moving average - stage 1.
- Mode 3:
1. Fast moving average above the upper channel level - stage 3.
2. Fast moving average inside the channel - stage 2.
3. Fast moving average below the lower channel boundary - stage 1.
- Mode 4:
1. Fast moving average above the upper channel level - stage 4.
2. Fast moving average above the channel mean but below the upper channel - stage 3.
3. Fast moving average above the lower channel boundary but below the channel mean - stage 2.
4. Fast moving average below the lower channel boundary - stage 1.
2. Volatility base type. How volatility is calculated:
1. Day - intraday.
2. Week - intraweek.
3. Candle - based on the original data's base timeframe.
3. Volatility variable type:
1. Percent - in percentage from LOW to HIGH for the data's period.
2. Absolute - in absolute expression from LOW to HIGH for the data's period.
4. Slow sma len - length of the slow-moving average (center of the channel).
5. Fast sma len - length of the fast-moving average (signal moving average).
6. Channel Deviation - deviation multiplier of the channel boundaries from the center.
If you have any difficulties or questions, please write to the support chat. Link