Tester Light in Os Engine.

Good day, in this article we will get acquainted with «Tester Light».
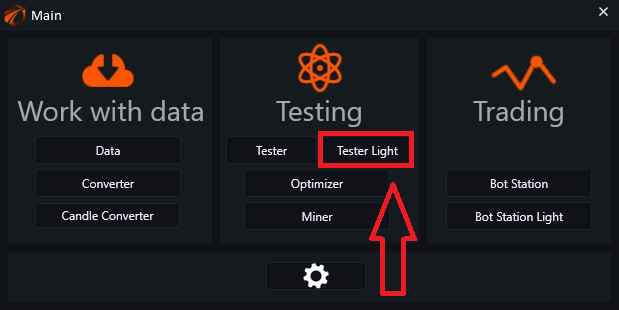
Open OsEngine:

In the main menu window, select Tester Light:
We end up in the settings window like this:
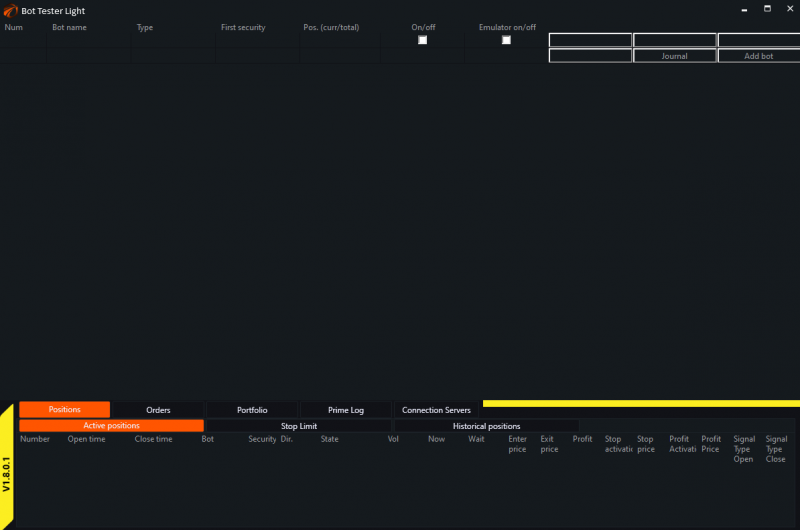
First of all, we need to understand how the exchange emulator works. What can be inputted into it and how to configure securities. To do this, click on the «Connection Servers» button:

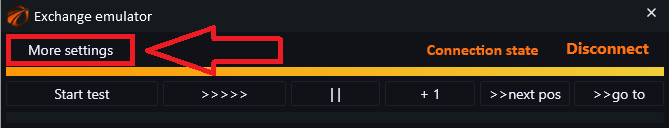
A control panel for testing progress will appear in front of you. It will be useful for providing data to the tester. But for now, let's click on the «More settings» button:
To start testing, you need to connect the historical data of the ticker you need.
Source.
In Os Engine, there are two options for connecting historical data, which can be seen by clicking on the arrow icon:
- Set.
- Folder.
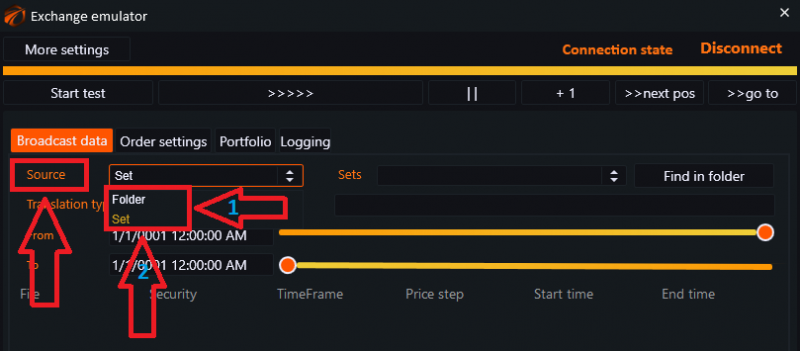
«Set» - a module for downloading and storing historical data of candles, ticks, and order book snapshots using connectors, as well as from the Finam server.
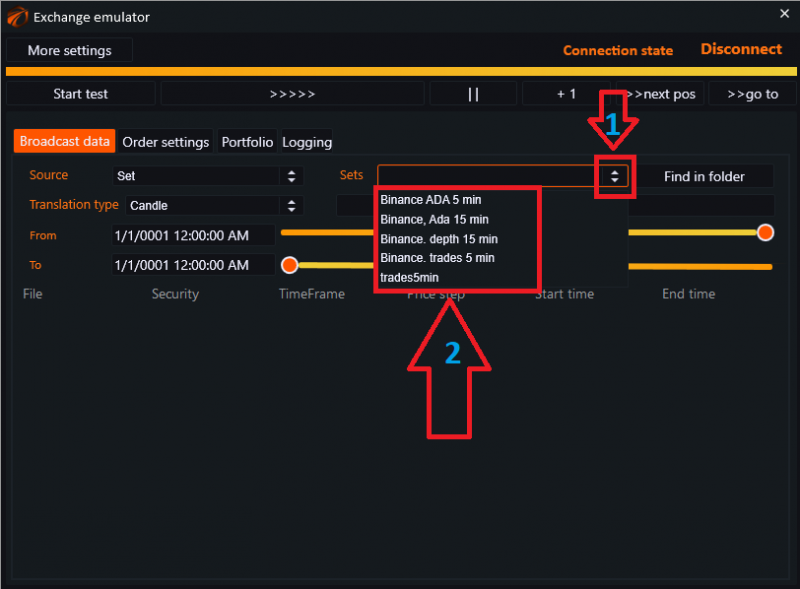
If we use this method of data transmission, then in the selection line, the tested instrument is «Sets».
- Click on the arrows.
- Select the instrument.
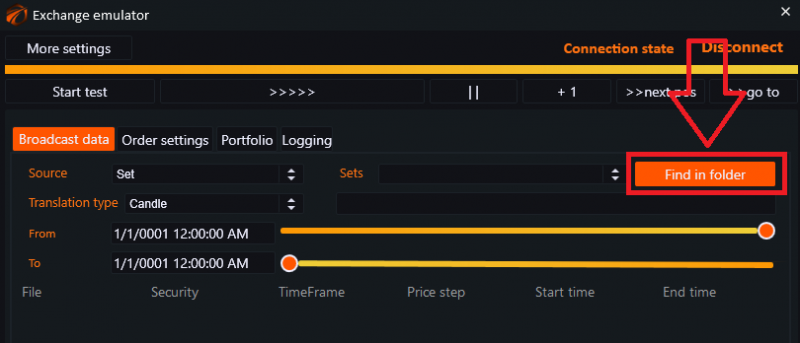
«Folder» - loading previously downloaded data from a folder. You need to specify the path to the folder with the downloaded tickers using the «Find in folder» button. You can only store tickers of the same timeframe in the folder.
We search for the desired folder, open it. You can download the data to any folder on your computer.
Select the folder with the desired set, open it.
Click on the folder with the timeframe.
Click «OK».

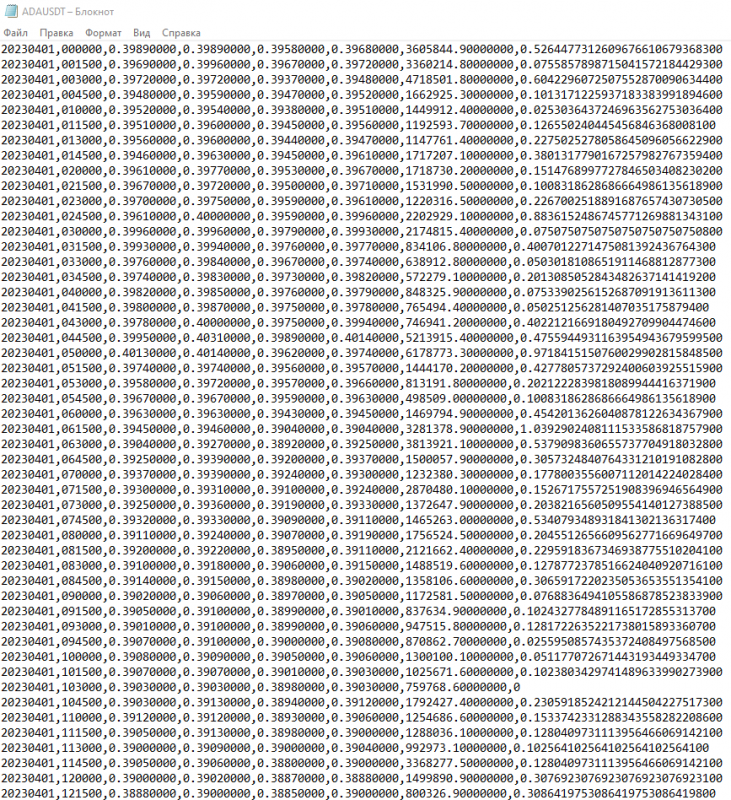
The storage format is a text file, as shown in the example.
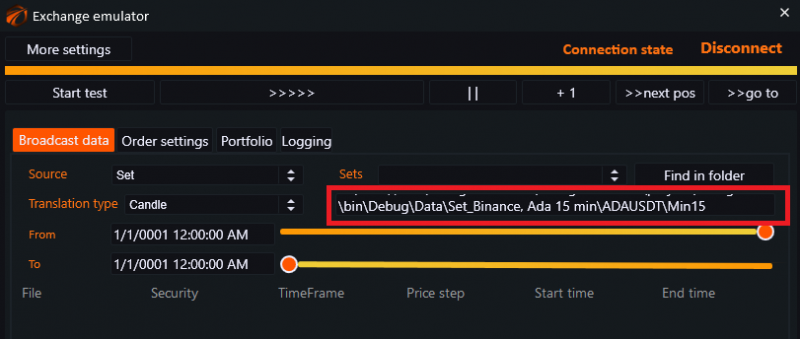
The data will appear in the line:
«Translation type» - contains 5 different types of data that serve for different tasks and help improve optimization results.
- Click on the arrows.
- Select the desired type of data.
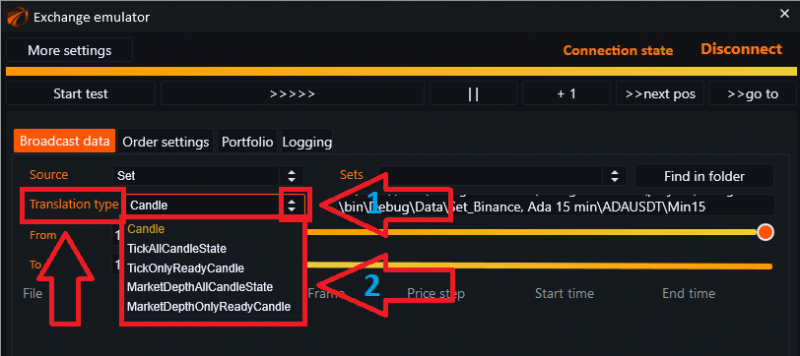
«Candle» - completed candles.
«TickAllCandleState» - ticks and all changes in candles.
«TickOnlyReadyCandle» - ticks, and candles only upon their completion.
«MarketDepthAllCandleState» - order books and all changes in candles.
«MarketDepthOnlyReadyCandle» - order books, and candles only upon their completion.
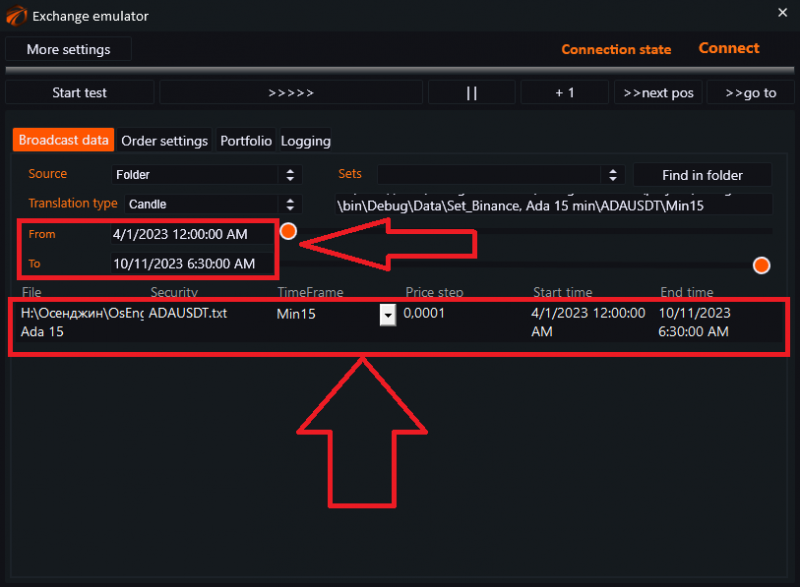
After selecting the data and successfully loading them, the tickers will become visible below the settings.
The period for which the data is taken is set automatically.
Adding a robot.
We close the settings window, return to the main menu of the tester, and click on the «Add Bot» button.
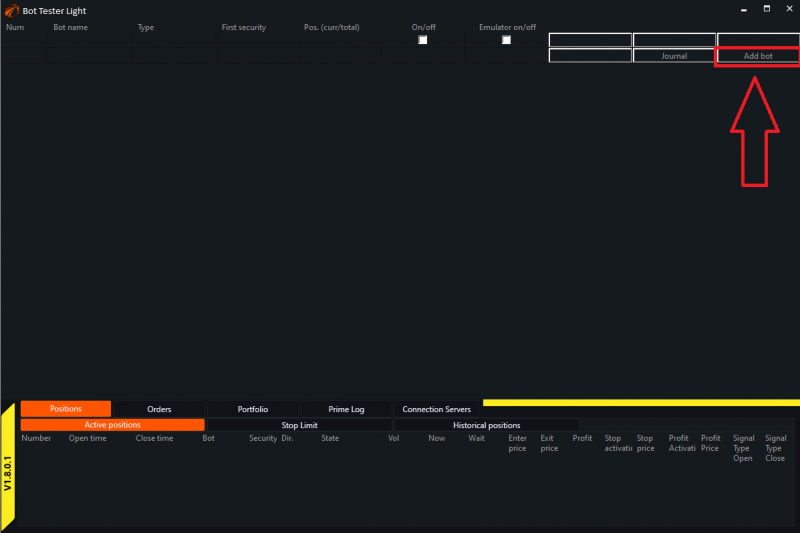
The «Robot Create» panel opens:
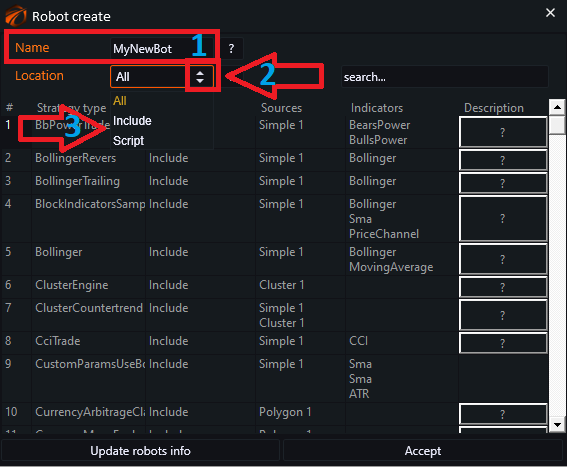
1. «Name» - a field where we need to enter the name of our bot. It cannot be changed later.
2. Click on the arrows to choose the location to create the bot.
«Scripts» - when clicked, a list of robots that you have written or added manually will appear. There are also many free ready-made script examples available here. Use them!
3. «Built-in» - free robots that you can also use.
The entire list of available robots can be scrolled using the mouse wheel or the scrollbar.
You can use the search function to find a specific robot or script.
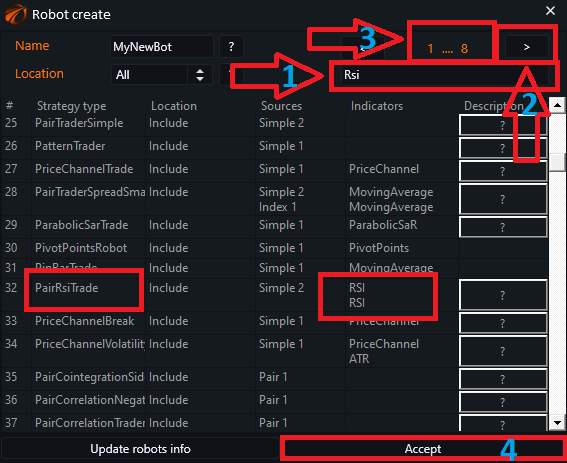
1. Enter the name or a single word from the title.
2. Use the arrows to browse through the pages where the entered word appears in the search field.
3. The number of pages where the word appears.
4. «Accept» - the button to confirm the selection.
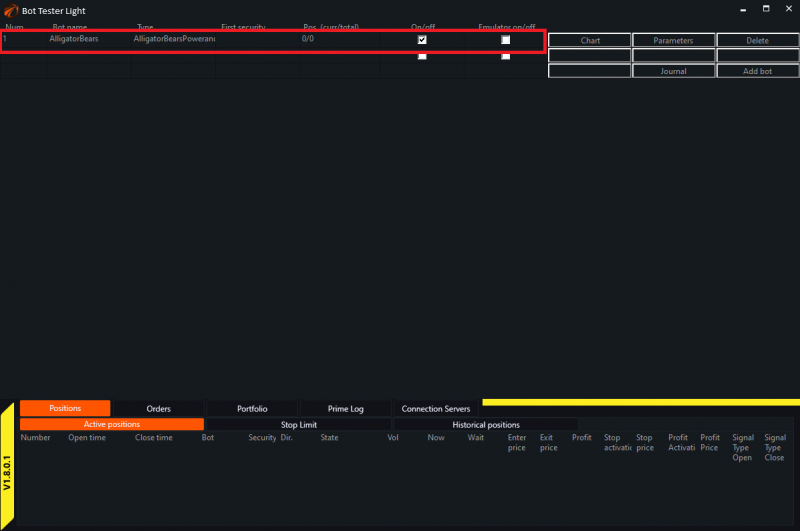
If everything is done correctly, the robot will appear in the line.
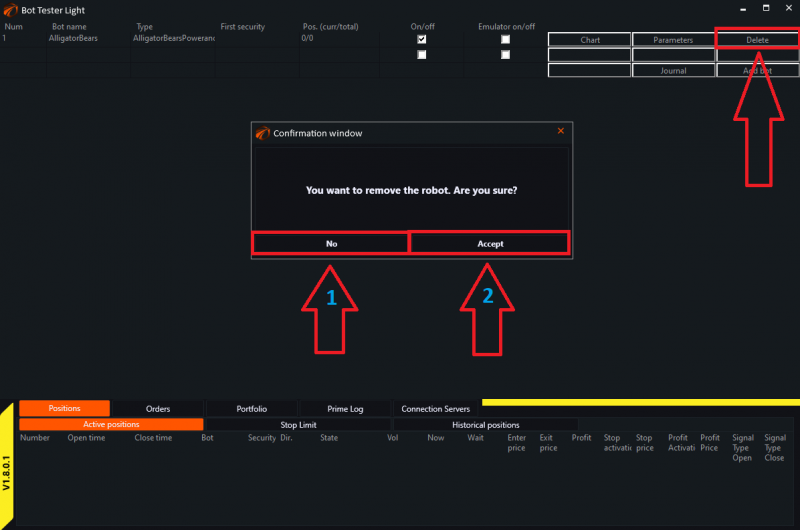
Deleting robots.
If you want to delete a robot that you previously added to the tester, click the «Delete» button:
- «No» - cancels the selected command.
- «Accept» - confirms the selected action.
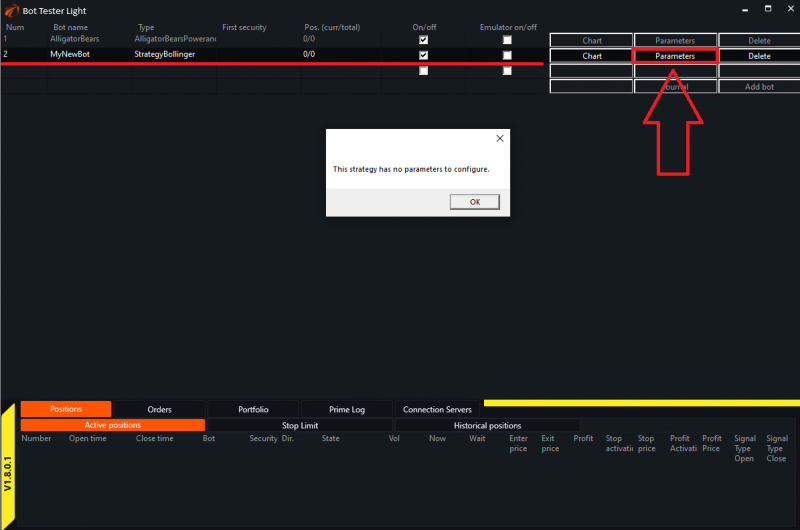
Robots can have parameters or not. If the robot you added to the tester does not have parameters, then when you click the «Parameters» button, the system will notify you about it, and you can simply skip this settings option:
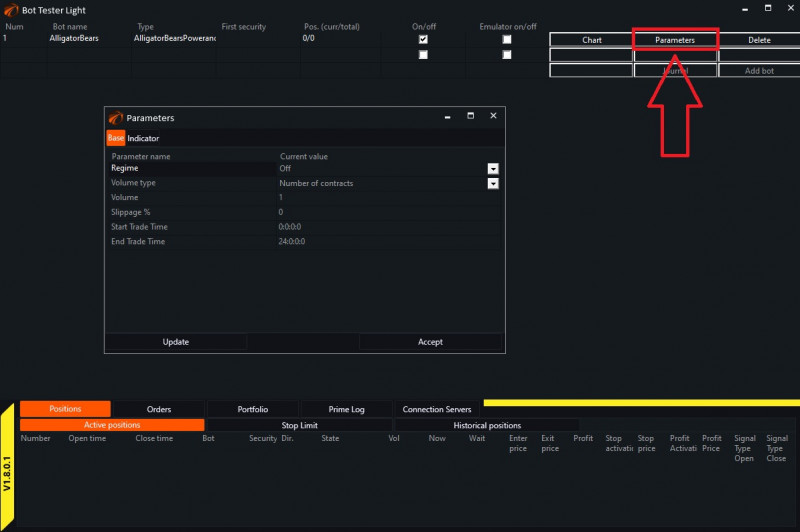
Since our example robot has parameters, when we click the «Parameters» button, a corresponding window appears where we can set our settings:
1. We adjust basic and additional settings.
2. We change the mode from «Off» to the one we need.
3. After performing all the necessary actions, we click «Accept».
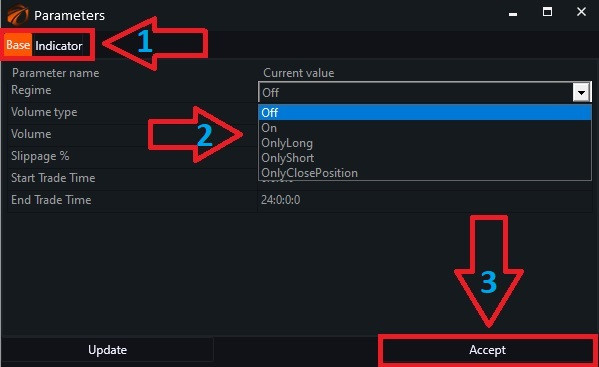
Chart.
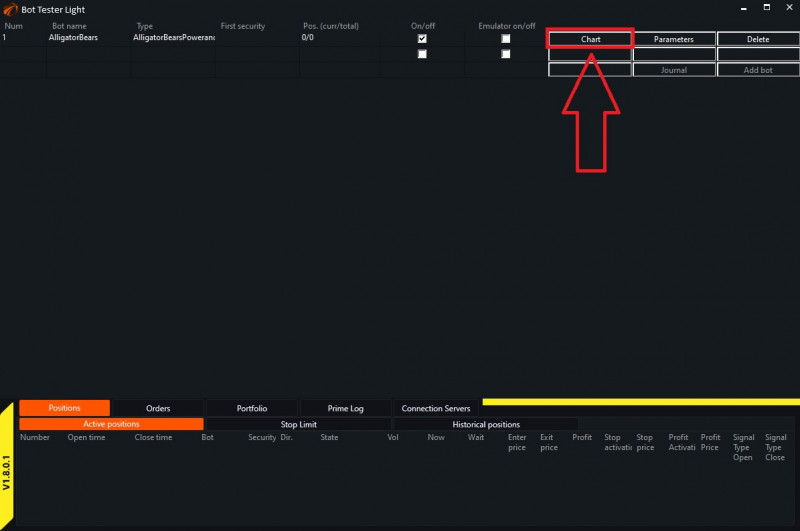
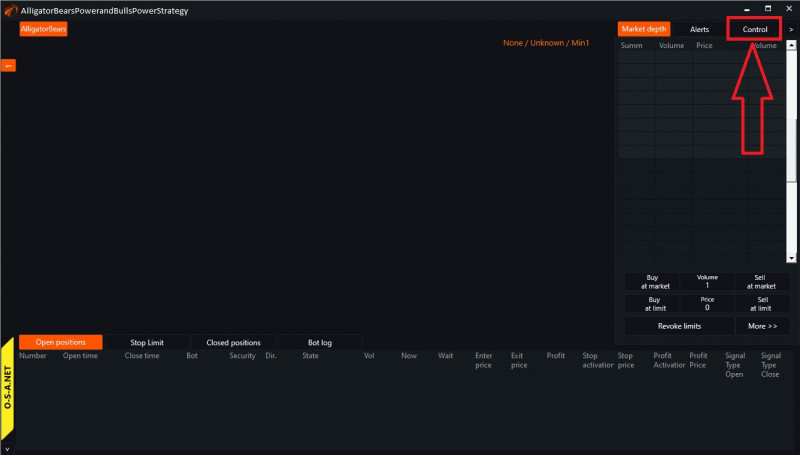
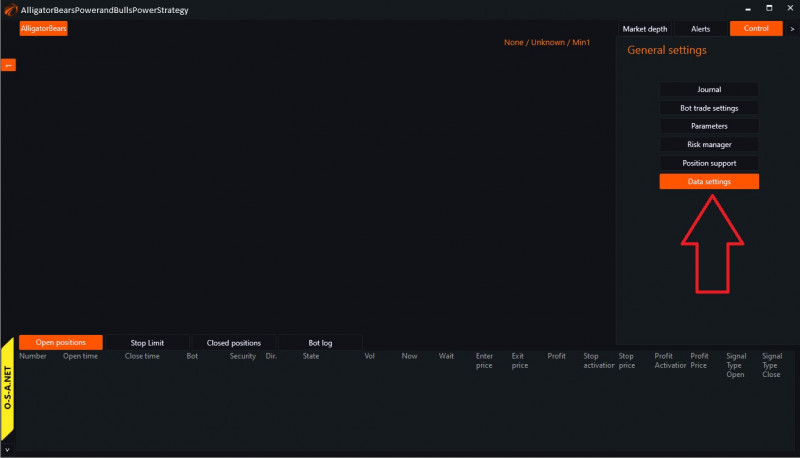
Next, go to «Control»:
In order for the robot to connect to the server and start receiving data, you need to click on the «Data Settings» button.
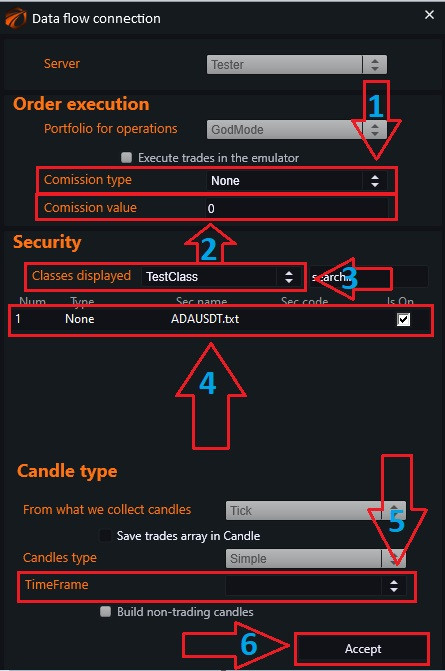
- «Comission type» - has three modes:
- «None» - disregard the commission;
- «OneLotFit» - commission per lot;
- «Percent» - commission in %.
- «Comission value» for each exchange individually.
- «Classes displayed» - filter for the next field. Select the desired class.
- Instrument, for which the data will be taken and which we will test. Check the box.
- «TimeFrame» - time interval.
- «Accept» - confirmation button.
Risk Manager.
This function allows you to monitor drawdown. By calling the corresponding menu, you can configure its operation.
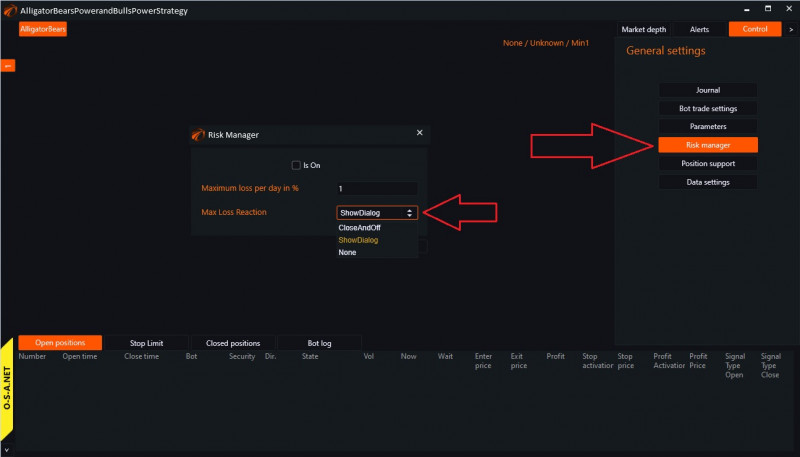
The settings are intuitive and labeled. Here, you can set a loss limit per day for the robot and the type of reaction to this loss.
Position Support.
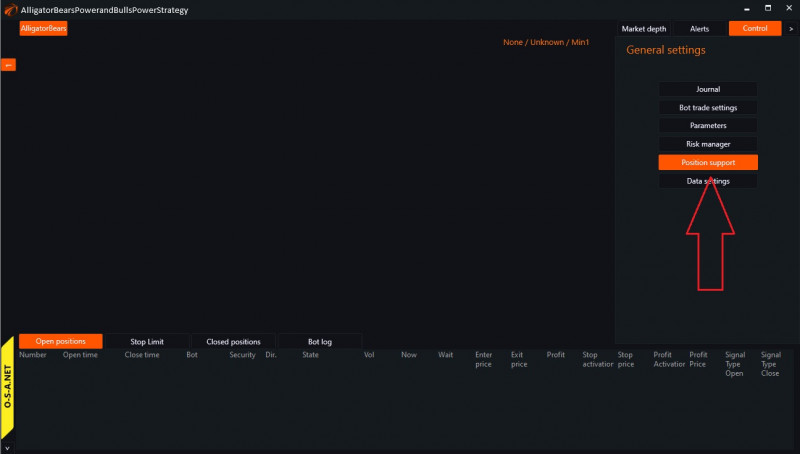
For any position opened within the robot, standard methods for managing it can be assigned.
The following window will appear:
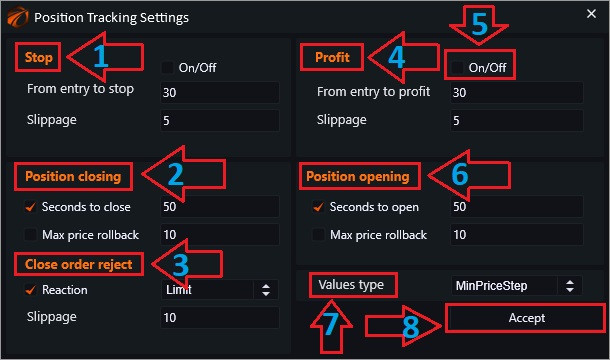
1. «Stop».
- A regular stop order that will be placed at the actual entry price of the position +/- the «From Entry to Stop» value. Additionally, slippage can be set, which will be applied to the final order for buying/selling in the system.
2. «Position closing». 6. «Position opening».
- These parameters can be used to regulate the amount of time the order has for execution. After this time has passed, the order is canceled by the exchange.
- If it is an opening order and it is completely unfilled, the position is considered invalid. If the order is partially filled, the position is considered open.
- Max price deviation is the distance in points by which the price can «move away» from the order price before the order is canceled.
- If the order is canceled for a previously opened position, the closure has not been executed. In such cases, it is better to use the block below.
3. «Close order reject».
- There are cases when an order to close a position is canceled or not executed. For example, a stop order did not trigger because the market moved away from it.
- For such cases, a reaction can be set. «Market» will close your position at the market price. «Limit» will close it with a limit order and a pre-set slippage.
4. «Profit».
- A regular take profit order that will be placed at the actual entry price of the position +/- the «From Entry to Take Profit» value. Additionally, slippage can be set, which will be applied to the final order for buying/selling in the system.
- Max price deviation is the distance in points by which the price can «move away» from the order price before the order is canceled.
- If the order is canceled for a previously opened position, the closure has not been executed. In such cases, it is better to use the block below.
5. «On/Off».
- Check the boxes where you want them to be considered in the tests.
7. «Values type».
8. «Accept».
Index Calculation.
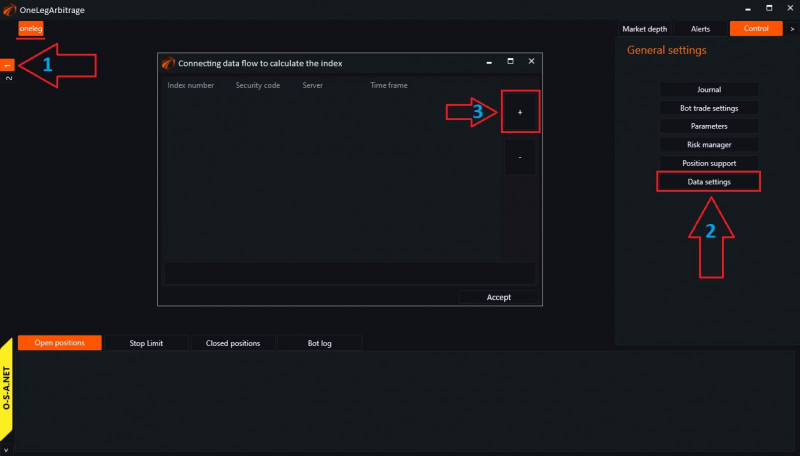
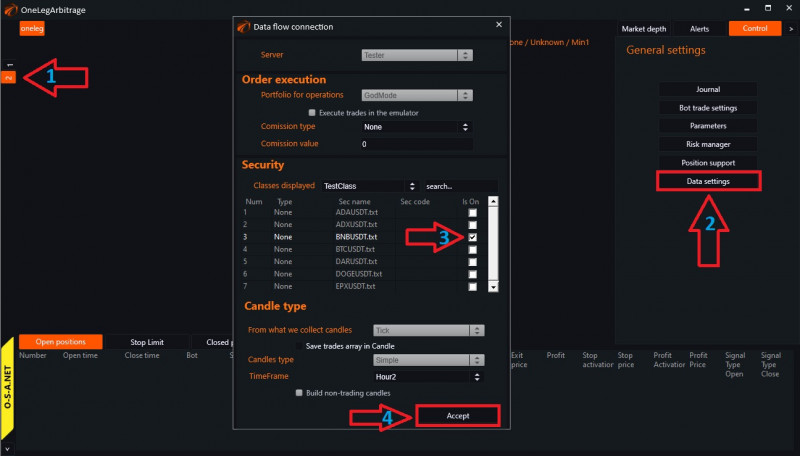
If you have a robot in which the logic is programmed for an index (in the example shown in the image below, we have OneLegArbitrage), in order for it to work, you need to add it and write the formula by which it will be calculated.
To do this, go to «Data Settings». Note that the robot has 2 tabs. If you enable the second tab and click «Data settings», the window for standard settings will appear. We need the first tab here. In the opened window, click on the «+» button.
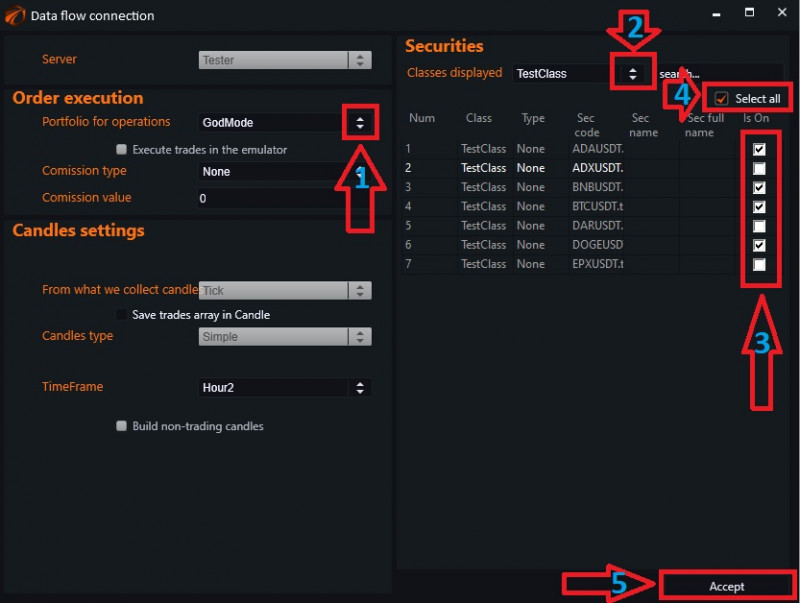
1. «Portfolio for operations»:
- Click on the arrows and select «GodMode».
2. «Classes displayed».
- Click on the arrows again and select «TestClass».
3. You can manually select the instruments by checking the boxes next to the ones you will use.
4. If you check the box next to «Select all», all the instruments from the list will be selected.
5. After performing all the necessary operations, click on the «Accept» button.
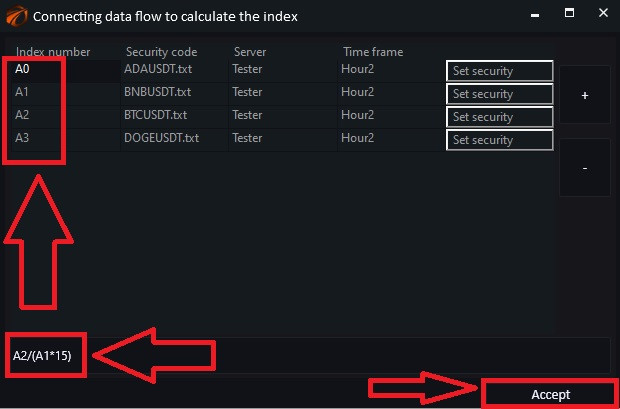
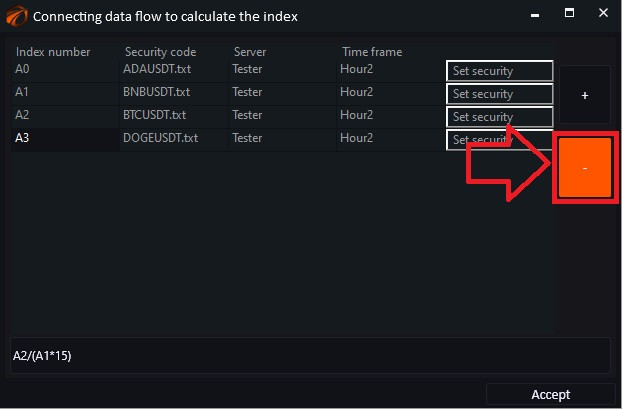
We can see that the selected instruments have been added, now:
- When adding an instrument, it is assigned an index number. This unique name will be used in the formula.
- Write the calculation formula (which may differ from the example provided).
- Click «Accept».
If you need to remove an instrument from the list, click on «-»:
Close this window and switch to the second tab (1).
2. Go to Data Settings, and the settings window will open.
3. Select the trading instrument that we will use - the one that we used in our formula, which we wrote in the settings on the first tab.
For pair trading, select 2 trading instruments.
In this way, you need to add all the robots that you plan to trade index arbitrage with.
Launching testing.
To start the test again, go to «Connection Servers»:
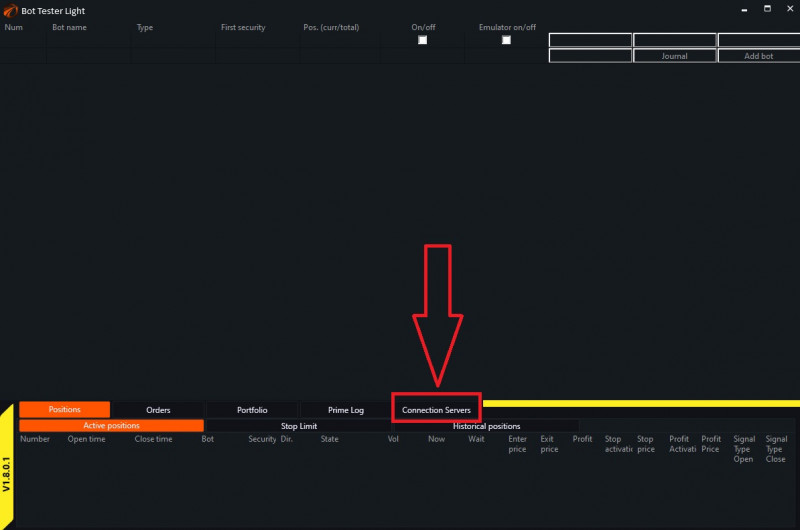
The Exchange Emulator opens.
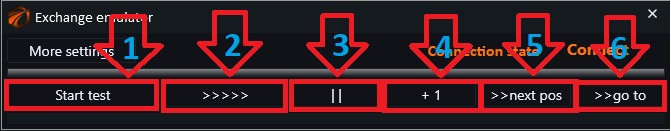
1. Click the «Start Test» button to start testing from the beginning. At this point, all your old positions are cleared in the emulator. The portfolio returns to its initial state. Data is then sent from the server, bar by bar/tick by tick.
2. The «>>>>>>» button allows you to enable rewind mode during testing. In this mode, all visual panel elements disappear. Testing in this mode is much faster, as rendering elements is the heaviest task for the robot.
3. The «||» button stops or restarts the data feed process.
4. The «+1» button loads one candlestick and enters pause mode.
5. The «>> to the deal» button moves to the next deal.
6. The «>> go to» button allows you to go to a specific date.
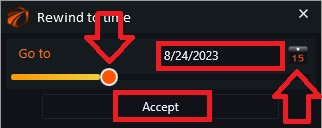
Set the desired date using the calendar or move the orange slider and click «Accept».
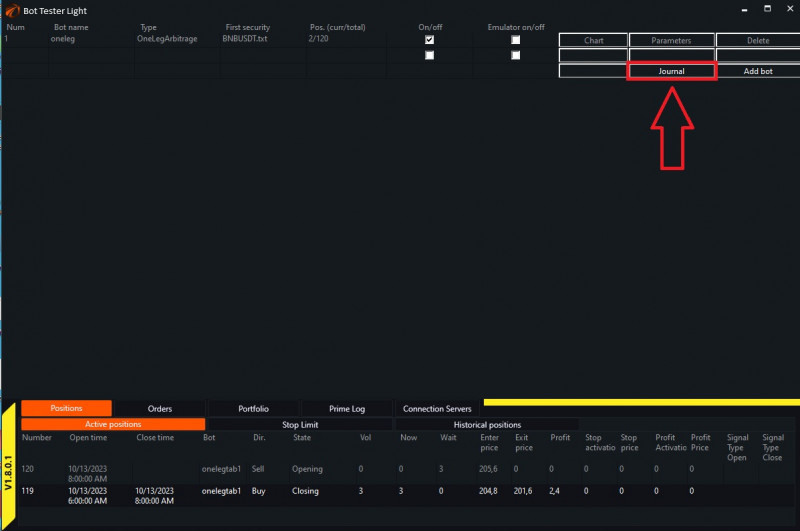
Journal.
All test statistics can be viewed in the journal. The journal can be accessed by clicking the corresponding button in the main menu.
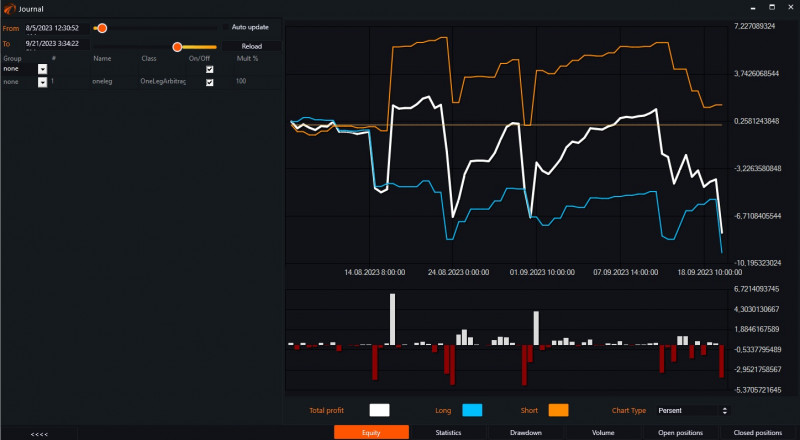
Equity.
When opening the journal, we immediately go to the «Equity» tab. This tab provides graphical information about the account growth. It displays the overall profit, as well as separate profits for long and short trades.
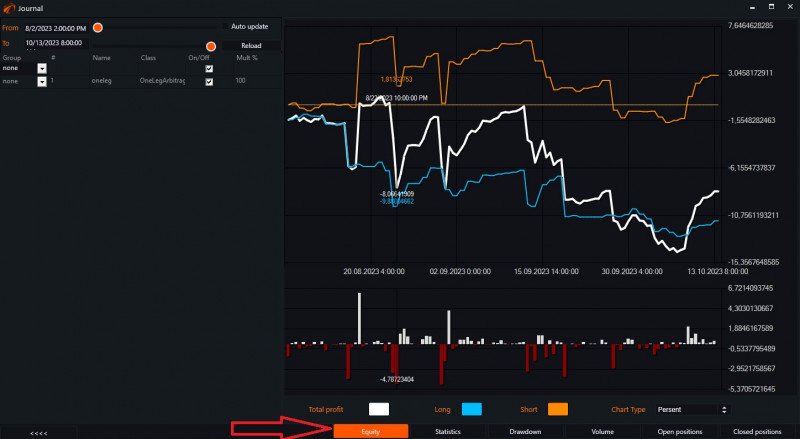
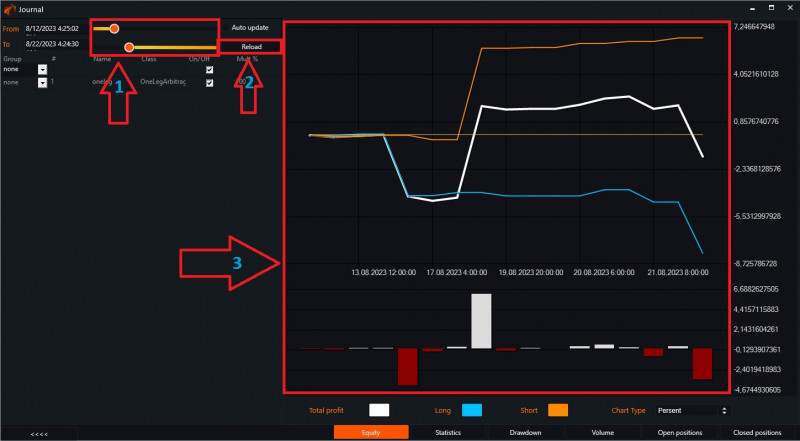
On the left side, there is a panel that allows you to view changes at a specific moment in time.
1. Use the sliders to set the desired date.
2. Click «Reload».
3. See how our equity changes.
Statistics.
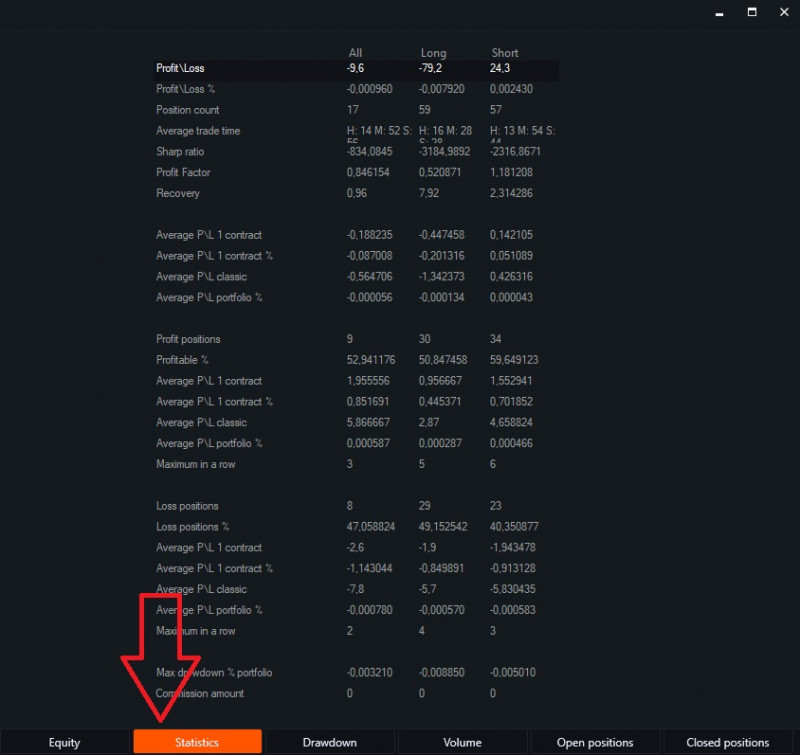
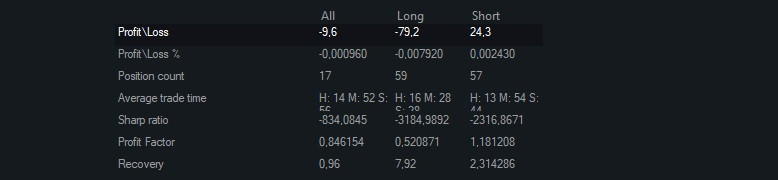
Profit/Loss - profit or loss from all operations.
Profit/Loss % - profit or loss as a percentage of capital.
Position count - ...
Average trade time - average time a position is held.
Sharp ratio - an indicator of investment portfolio efficiency, calculated as the ratio of the average risk premium to the portfolio's standard deviation.
Profit Factor - the ratio of the total profit earned during a specific time period to the losses.
Recovery - shows how much profit surpasses the depth of the maximum drawdown.
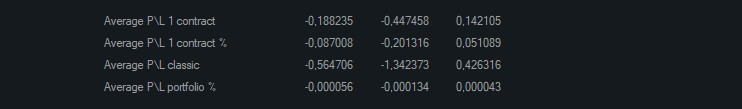
Average P/L 1 contract - averaged profit from the movement in absolute terms, excluding the volume. Only the movement of the instrument from entry to exit.
Average P/L 1 contract % - averaged profit from the movement in percentage terms, excluding the volume. Only the movement of the instrument from entry to exit.
Average P/L classic - averaged profit from the movement, taking into account the volume.
Average P/L portfolio % - averaged profit from the movement in percentage terms, taking into account the volume, calculated relative to the previous portfolio value.
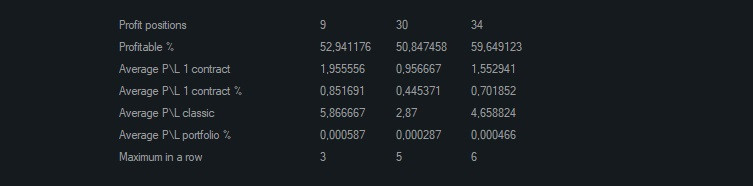
Profit positions - ...
Profitable % - percentage of profitable trades out of the total number of trades.
Average P/L 1 contract - average instrument movement during position holding.
Average P/L 1 contract % - average instrument movement in % during position holding.
Average P/L classic - average profit from a position.
Average P/L portfolio % - average profit from a position relative to the portfolio.
Maximum in a row - number of consecutive profitable positions.
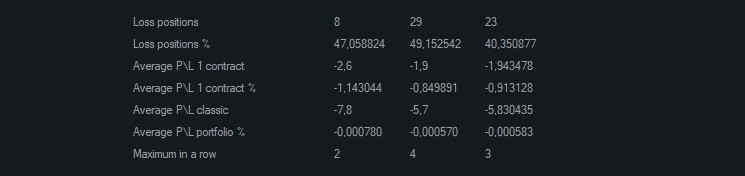
Loss positions - ...
Loss positions % - percentage of losing trades out of the total number of trades.
Average P/L 1 contract - averaged instrument movement during position holding.
Average P/L 1 contract % - averaged instrument movement in % during position holding.
Average P/L classic - average loss from a position.
Average P/L portfolio % - average loss from a position relative to the portfolio.
Maximum in a row - number of consecutive losing positions.
Drawdown.
This tab shows the dynamics of drawdown changes during the trading period.

Volume.
This tab shows the maximum tradable volume.

This tab will be useful for controlling and monitoring trading volumes. This is very convenient when multiple trading algorithms are connected and trading is done on different instruments.
Open Positions.
This tab shows the current open positions that the bot has at the moment.
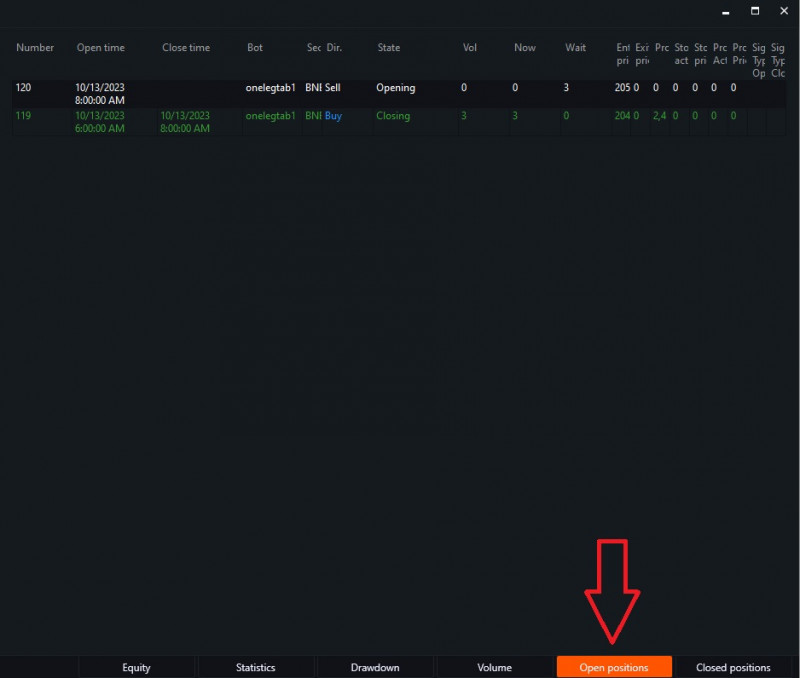
Bot - the name of the robot that executes the trades.
Security - the name of the instrument.
Dir. - the direction of the trade, Buy or Sell.
State - the current state of the trade.
Vol - the volume of the trade that the bot should enter.
Now - the executed volume.
Wait - the volume not yet executed, but waiting for execution.
Enter price - the price at which the bot entered the position.
Exit price - the price at which the bot exited the position.
Profit - the profit or variation margin from this trade.
Stop activation - the activation price of the stop order. Once this price is reached, the order will be placed.
Stop price - the price at which the stop order will be executed.
Profit Activation - the activation price of the profit order. Once this price is reached, the order will be placed.
Profit Price - the price at which the profit order will be executed.
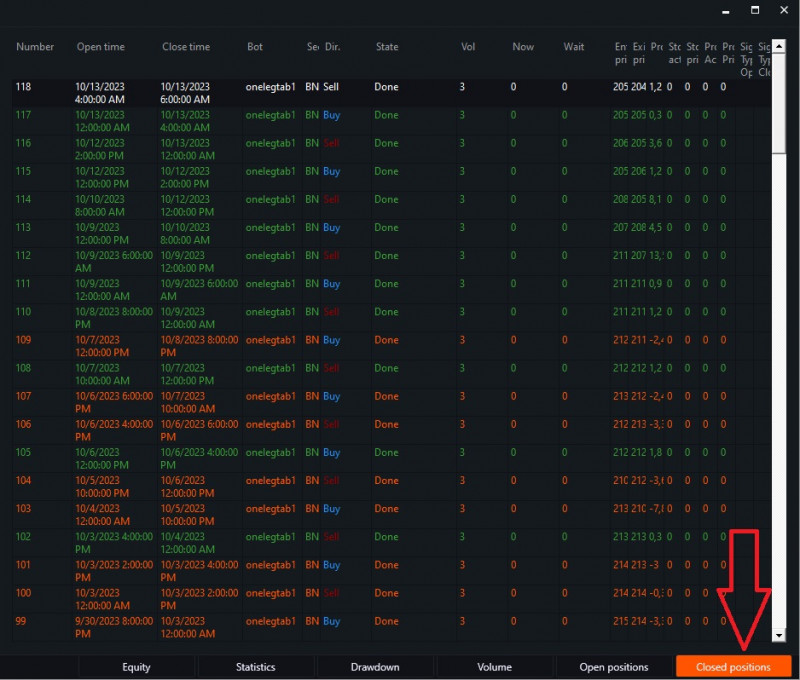
Closed positions.
This tab displays all closed trades or, in other words, a table of all executed trades.
The general journal has been discussed above. To see information for each individual bot, do the following.
Click the «Chart» button next to the bot you are interested in.
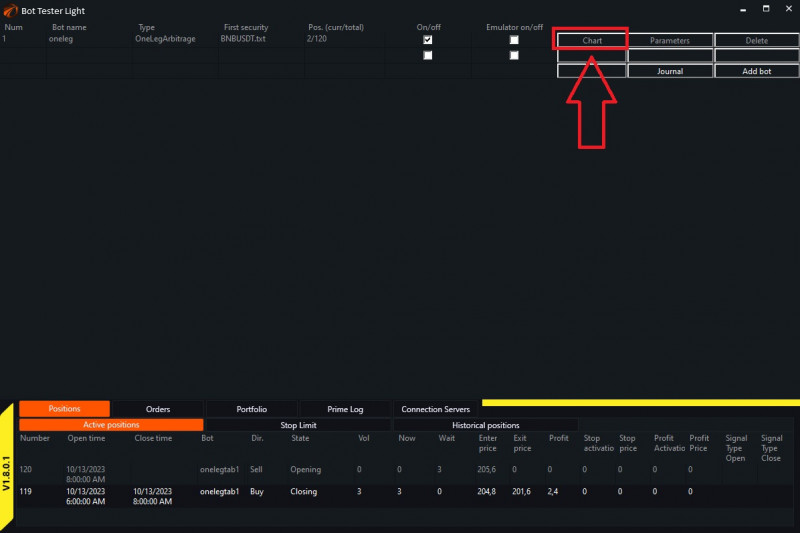
Then,
1. Click «Control».
2. Click «Journal».
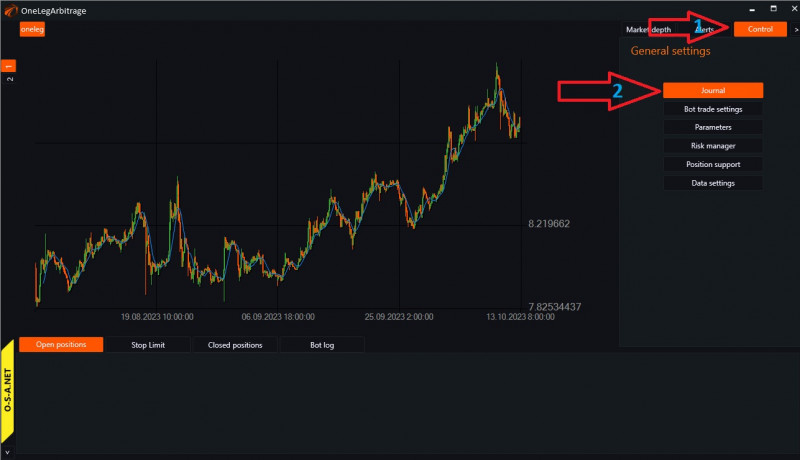
And you will arrive at the journal of the specific bot, where you can view information for each tab just like in the general journal.
If the result is not satisfactory, you can go to «Settings», change the settings, and restart the testing process.
Important! Before changing the settings, it is better to record or take a screenshot of the old settings, so that there is the possibility to compare and, if necessary, revert to the previous settings.
If you have any difficulties or questions, please write to the support chat. Link