Setting up BotTabCluster from the visual interface.

Using the already created bot in the OsEngine as an example, let's go through the process of setting up cluster data sources. In the source code and within our project, this data source is called BotTabCluster.
Open Bot Station Light and click on the button to create a robot:
 Fig. 1. Creating an instance of the Clustertrend robot.
1. Click the "Add Bot" button in the control panel.
2. Select the necessary bot.
3. Assign a name to the instance.
4. Click the "Accept" button.
After adding the robot, the terminal will look as follows:
 Fig. 2. Appearance of the program after adding the robot.
To open the window of the robot itself, click on the Chart button.
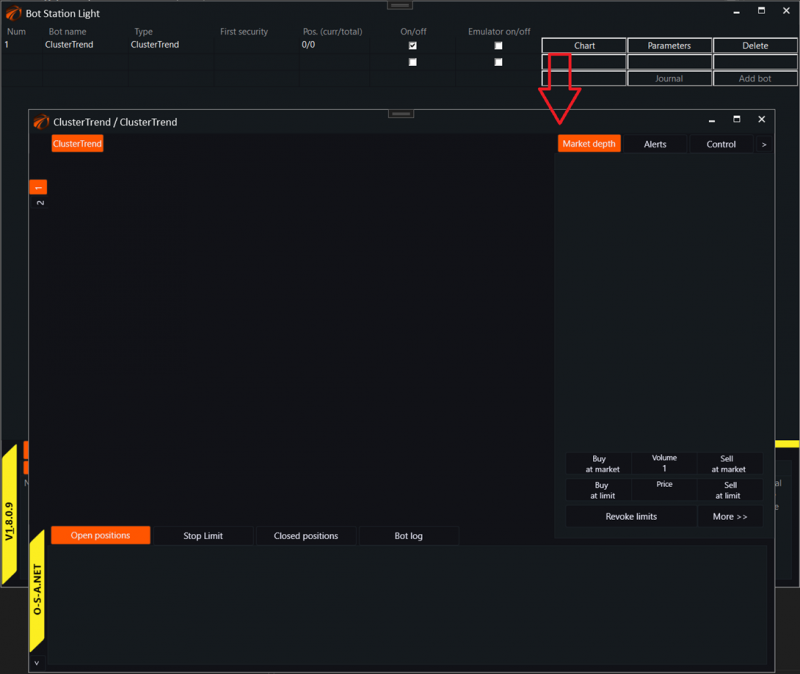
This specific robot has TWO sources:

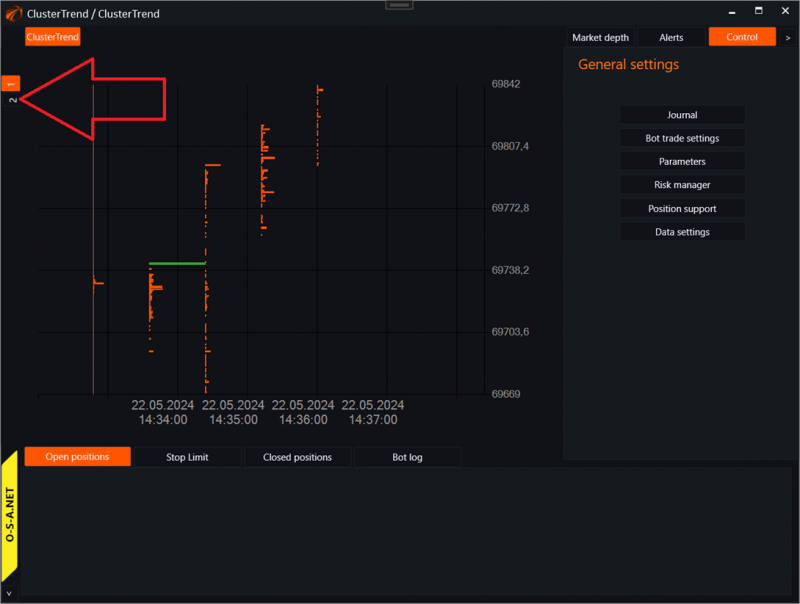
All sources created in the robot will be displayed on the chart panel in the order of their creation. In our case, BotTabCluster is the first one. To configure the tab, you need to activate it and click on the "Data Settings" button.
After that, the following window will open:
 Fig. 3. Cluster tab settings window.
1. Calling the data source settings window for the candles from which clusters will be formed.
2. Graph display method.
3. One section step - essentially its height, measured by the instrument's price.
There are 4 supported ways of displaying lines:
 Fig. 4. Cluster chart display method selection menu.
1. Total volume of buy and sell orders in a line.
2. Volume of buy orders only.
3. Volume of sell orders only.
4. Difference between buy and sell volumes.
Clicking on the "Setting source candles" button will open a window:
 Fig. 5. Data source settings for BotTabCluster.
1. Select a trading platform.
2. Execution settings for this connection.
3. Select a trading instrument. Only one security can be chosen.
4. Configure the requested data series. The chosen timeframe determines the time size of the cluster.
Since clusters are built from candle trades, it takes some time to form the graph. The cluster chart looks like this:
 Fig. 6. Cluster chart.
Additional information about a section will appear when hovering the mouse over it.
Remember, this robot has TWO sources. In order for the robot to work, simple data must be set up for the BotTabSimple tab, as trading will be done through it. This setting can be found here:
Trading will be done through the second source (BotTabSimple). This also needs to be connected to the data.
After all the settings are configured, the robot simultaneously sees two types of data. Candles and clusters with horizontal volumes.

If you have any difficulties or questions, please write to the support chat. Link