Regarding the basic idea and profit in pair trading.

Let's start with a review of what correlation and cointegration are. We have separate articles on this, but it wouldn't hurt to review it.
1. Theory on Indicators.
Before we start trading any two instruments...
About Cointegration:
The essence of seeking stationarity can be summarized as follows: we subtract one instrument from another using a certain multiplier. By varying the multipliers, we should obtain a sequence of values that are as close to zero as possible. Like this:
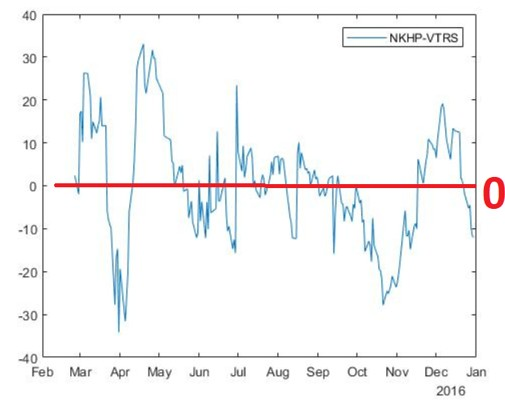
And if the sequence of values we obtain wanders around zero, then the pair is cointegrated and can be traded.
About Correlation:
In order to trade a pair, it should be correlated to some extent. Or conversely, we should observe a spike in decorrelation. Or correlation after a period of decorrelation. In general, another fancy indicator.
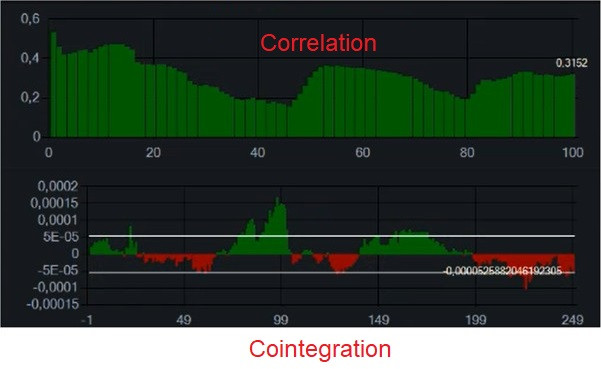
Actually, in OsEngine we have both correlation and cointegration calculations. It looks like this:
2. The main trading idea, in theory.
We currently have the ability to connect two instruments as a pair. And automatically generate a correlation graph between them based on predefined parameters. And a graph of residuals from the difference with a multiplier (cointegration, as we call it).
Also, two lines calculated by the standard deviation multiplied by another multiplier are superimposed on the cointegration graph.
These are the built-in features now available in OsEngine.
Naturally, all this is not done just for nice words, but in order to make money.
Classic pair trading on mean reversion.
If there is currently correlation between the instruments, and we find ourselves above the upper line based on the current deviation from the difference, we can sell the cointegration graph, anticipating that the instruments will converge.
If there is currently correlation between the instruments, and we find ourselves below the lower line based on the current deviation from the difference, we can buy the cointegration graph, anticipating that the instruments will converge.
Trading the pair in «breakout».
If there is currently decorrelation between the instruments, and we find ourselves above the upper line based on the current deviation from the difference, we can buy the cointegration graph, anticipating that the instruments will further diverge because at the current moment they are diverging and the correlation is strongly in the negative zone.
If there is currently decorrelation between the instruments and we find ourselves below the lower line based on the current deviation from the difference, we can sell the cointegration graph, anticipating that the instruments will further diverge because at the current moment they are diverging and the correlation is strongly in the negative zone.
3. Conclusion.
This is not the only idea in pair trading that can and should work in the market. These are basic, traditional truths.
And of course, in addition to what has been described, we have the ability to further complicate the basic idea to infinity. Other indicators, patterns, and anything else. But the basic idea of pair trading is encapsulated in the previous section. It is important not to deviate far from it.
If you have any difficulties or questions, please write to the support chat. Link