Optimizer in Os Engine. Numeric indicator of robustness in Walk-Forward optimization.

The term "robustness" means the ability of a trading strategy to replicate the results of its testing in the past on new data. And it would be great to measure this ability in numbers. In this text, I will introduce you to one of the metrics of strategy robustness that we have in OsEngine - the Walk-Forward Robustness Metric.
This is not something from Yandex or Google. This parameter was added to our WF Optimizer by our team, trying to obtain a numerical representation of the robustness of a particular result. It is very possible that something similar already exists somewhere. Be sure to contact us if a similar parameter is being discussed elsewhere and if there is a standard calculation for robustness during Walk-Forward that has escaped our attention: alexey@o-s-a.net.
1. Remembering the essence of robustness.
Example 1.
You have tested a strategy in a tester and see the result in a red square. Great! You have implemented the strategy in trading, and in real time over the next two months, the strategy gave you roughly the same profitability as in the tester:
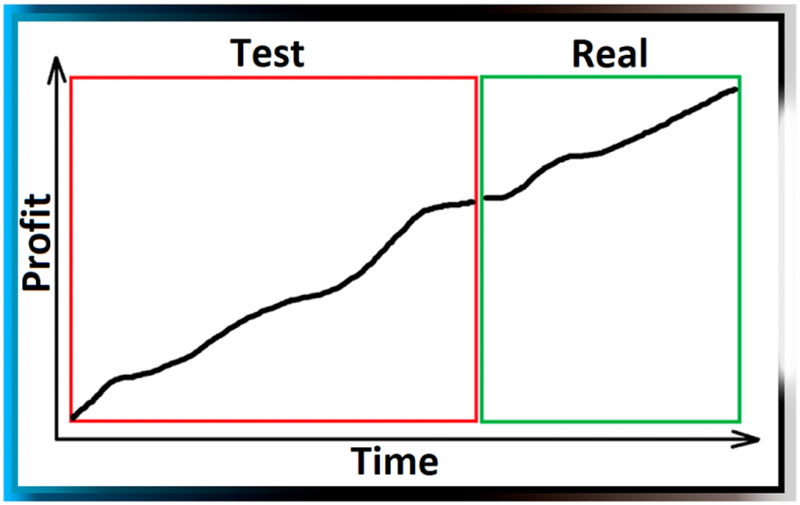 Fig. 1. Strategy with high robustness. Replicates testing results in real trading.
Example 2.
You have tested a strategy in a tester and see the result in a red square. You have implemented the strategy in trading, and in real time over the next two months (green square), the strategy resulted in losses:
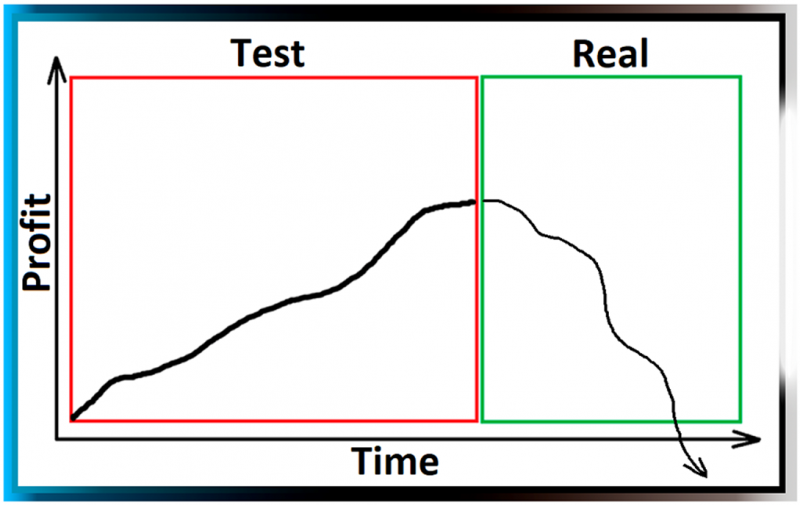
Fig. 2. Strategy with low robustness. Does not replicate testing results in real trading.
2. Where to look at robustness in numbers?
Within the Walk-Forward optimizer of OsEngine, there is its metric:
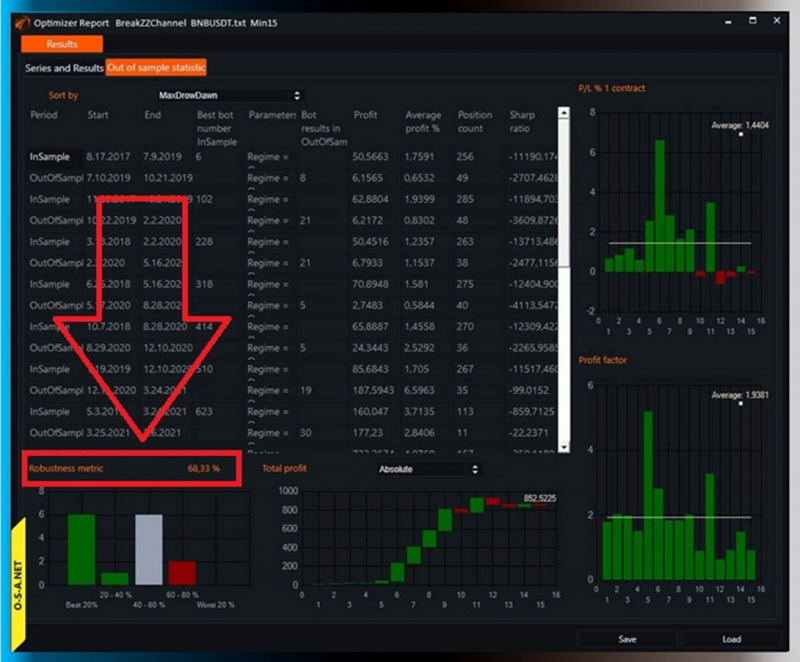 Fig. 3. Window of results of optimization of FW Optimizer in OsEngine.
Calculated from 0 to 100%. The closer to 100, the more robust the strategy is. The best result looks like this:
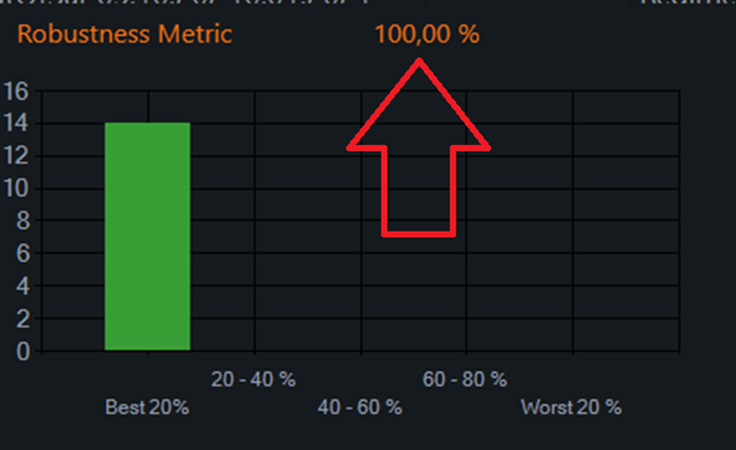
Fig. 4. The most good result is 100%.
In this case, I deliberately left the bar chart in the frame. It reflects the success of the chosen robot from InSample in a set of OutOfSample results. WFRM depends on what is in those bars. But... Let's go step by step.
3. Stages of WF optimization.
Usually. During the formation of stages for testing in Walk-Forward, a visualization of this kind is used:
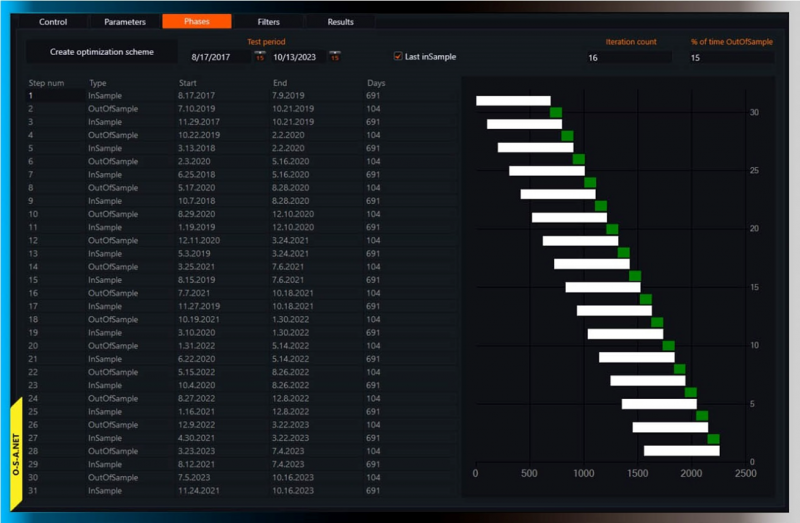
Fig. 5. Visual and tabular representation of WF optimization stages.
In this particular case, the history is divided into 14 pairs of InSample / OutOfSample. The last InSample has no pair because it is assumed that its OutOfSample will already be in reality.
4. InSample - OutOfSample pairs.
Robots with the same parameters are tested in each of these periods! In all 29 stages. THE SAME ROBOTS. This is true if no filters are included and the optimization process is done by Brut-Force (i.e., full traversal of all parameters).
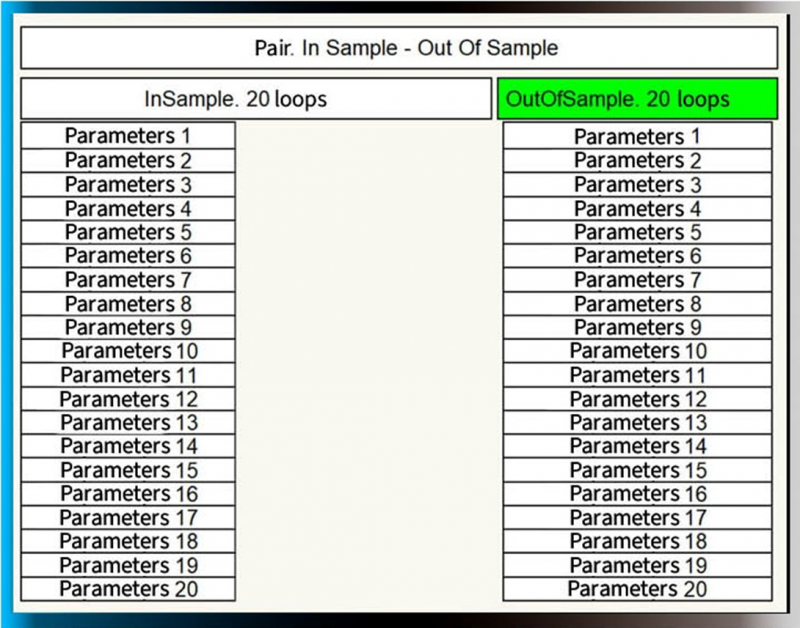
Fig. 6. InSample - OutOfSample. Only two tables of results.
There are 40 results in each pair.
5. Sort both tables by some parameter.
In this case, the parameter for sorting is Profit/Loss %.
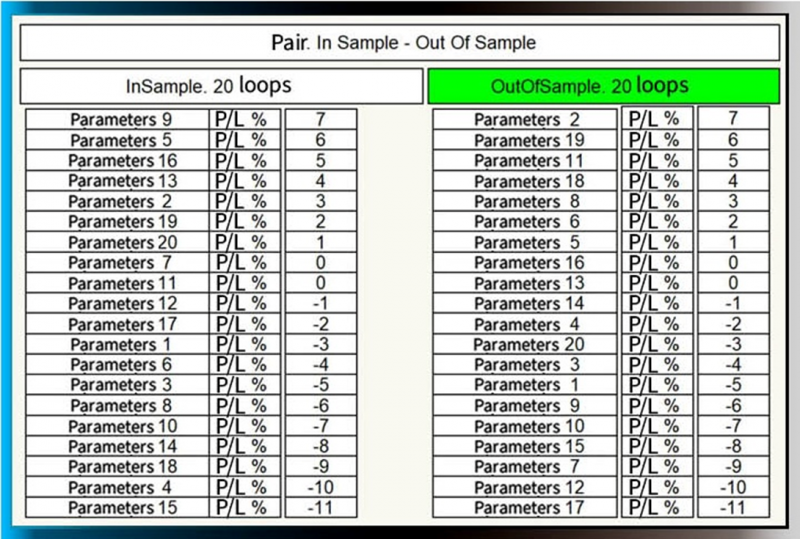
Fig. 7. Optimization results tables sorted by Profit/Loss %.
The best robot in the InSample period is robot number 9. We would hypothetically incorporate it into trading. Let's see under which number it appears in the OutOfSample period:
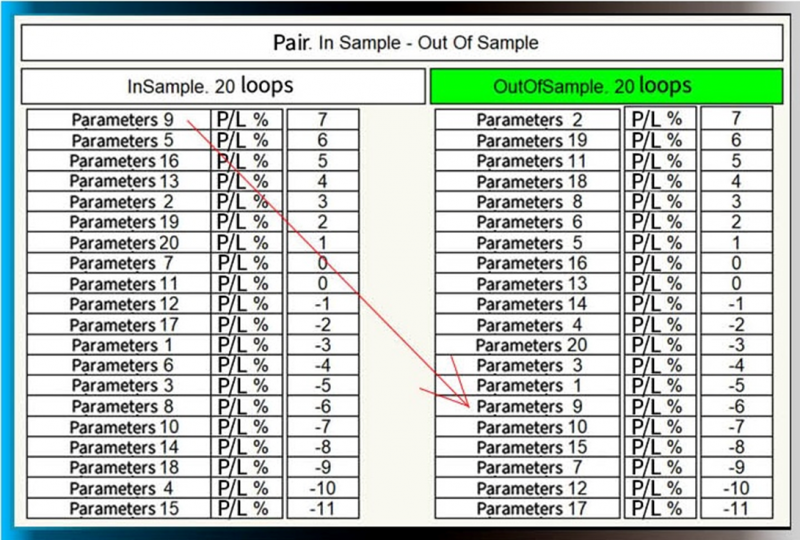 Fig. 8. Identifying the best performing robot from InSample in the OutOfSample period.
Based on the result, we add it to the corresponding cell on the chart:
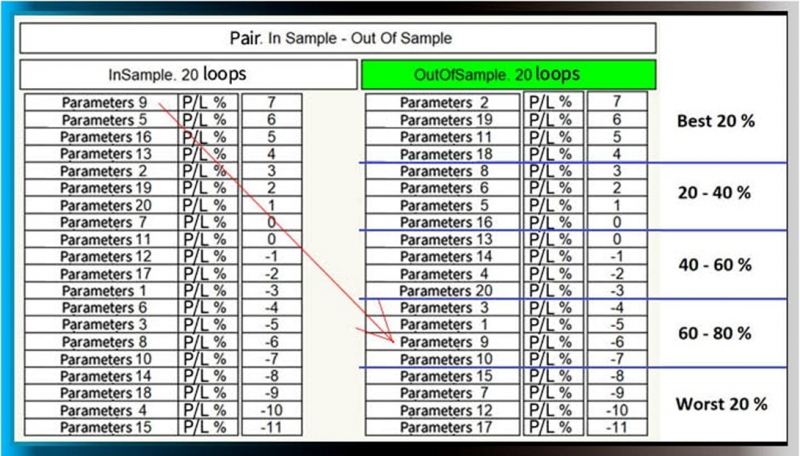
Fig. 9. Moving the result into a category based on performance.
In this case, here:
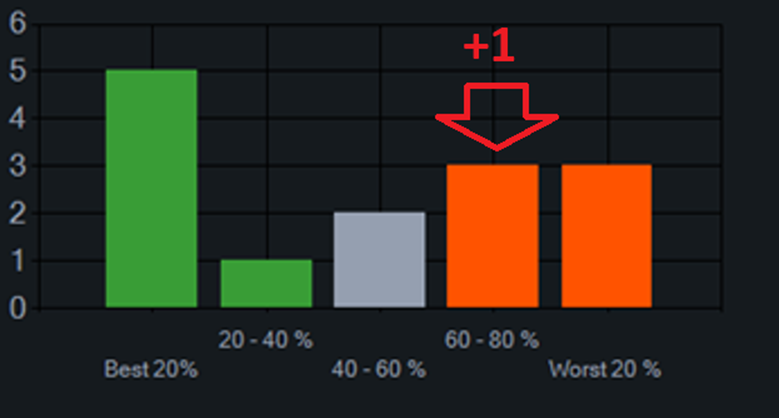 Fig. 10. Our "horse" falls in the penultimate performance category. Between 60 and 80% of others.
And in this way, we fill in this diagram. 14 pairs of InSample / OutOfSample. 14 added units in different cells.
6. Calculation of WFRM.
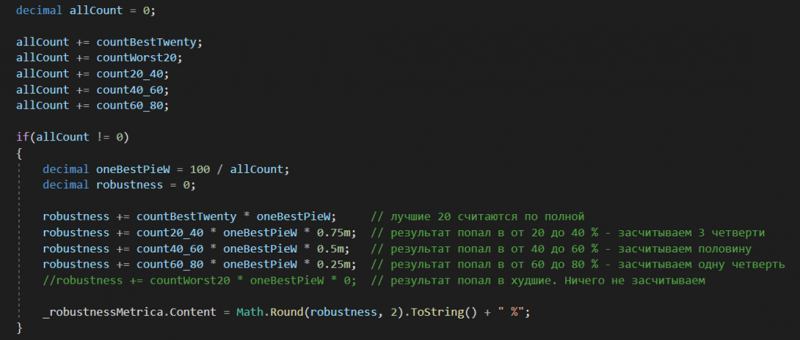
Fig. 11. WFRM calculation formula.
We assign a weight of 1 to the result of the pair from different columns with a different coefficient. We tried to calculate this indicator based on the X-axis Median, dividing the results in half. But this did not seem like a good idea to us. When there are not enough results, the median values turned out to be, to put it mildly, strange. So we settled on the option described above.
And in the end, we get WFRM:
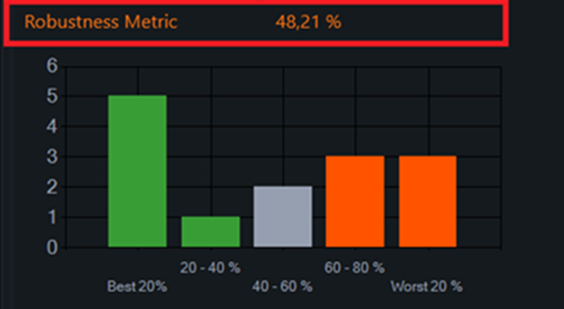
Fig. 12. Final WFRM.
7. Why might this be necessary?
Obviously, this is one of the most important indicators during Walk Forward optimization. Robots with the highest coefficient should be included in trading. WFRM should definitely be involved in filtering various algorithms.
Selecting the best robot to use in OutOfSample can be done in completely different ways:
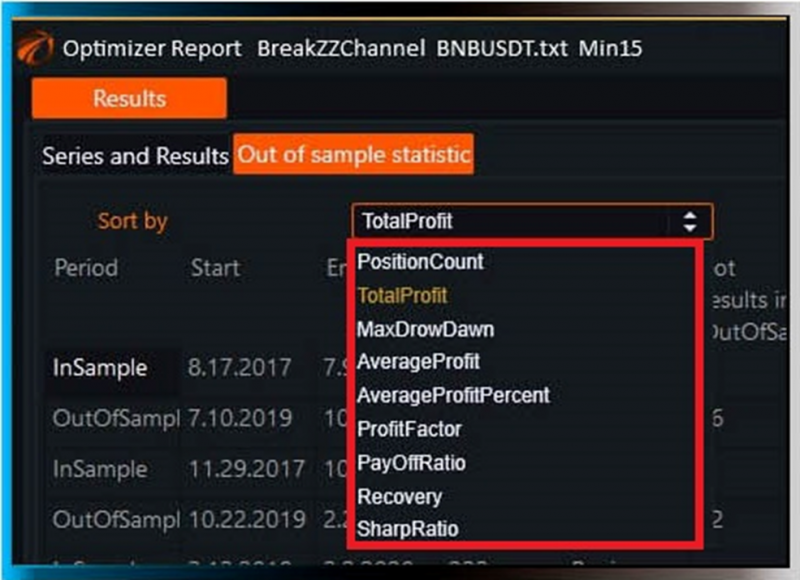
Fig. 13. Options for selecting the best robot from InSample in OsEngine.
In OsEngine, these are parameters:
1. Total Profit.
2. Max Drawdown.
3. Average Profit.
4. Average Profit Percent.
5. Profit Factor.
6. Pay Off Ratio.
7. Recovery.
8. Sharpe Ratio.
And different types of selecting the best robot yield different WFRM.
Therefore, to choose more robust settings for trading, a corresponding series of tests must be conducted.
Good algorithms!
If something doesn't work out or if you have any questions, please write in the support chat, link.