Journal in OsEngine.

The trade journal in OS Engine is an important tool for tracking and analyzing executed trades using the OS Engine software. This journal contains information about each trade, including the date, time, instrument, volume, entry and exit price, commissions, profit, and other related data.
There are two types of journals in OsEngine:
- General - shows statistics for all trading strategies.
- Individual - shows statistics for each individual robot.
General journal.
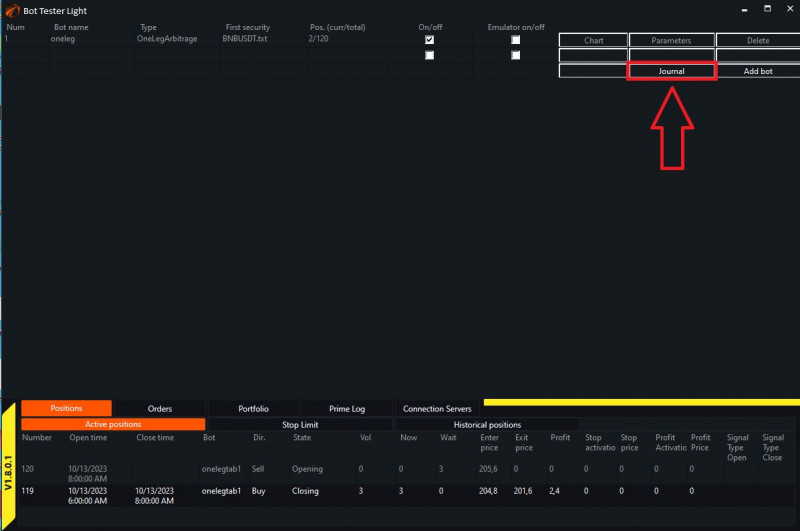
Let's start with the general journal, which is available by clicking a button in the main menu:
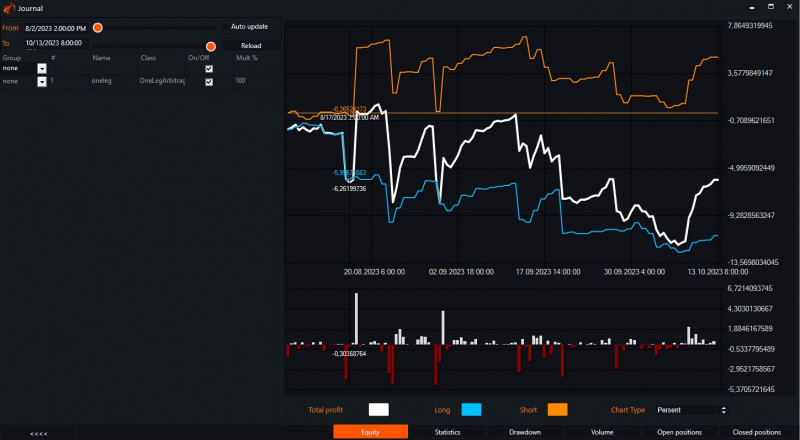
Equity.
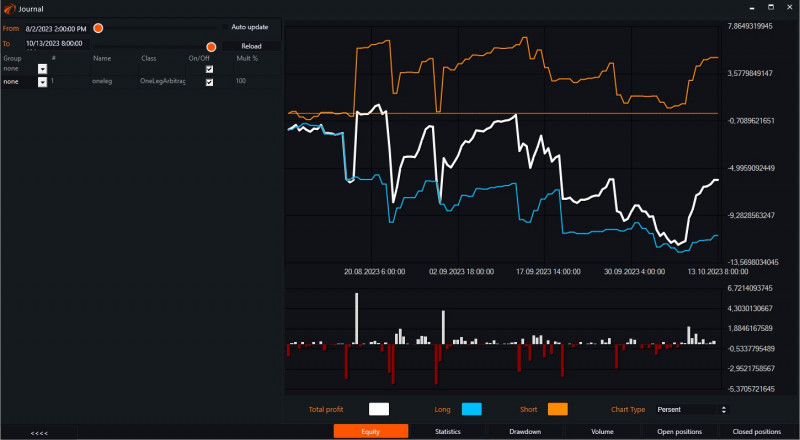
When opening the journal, we immediately land on the «Equity» tab. This tab shows graphical information about the account growth. It displays the overall profit, as well as separate profits for long and short trades:
Statistics.
In this tab, you can view all the trade statistics:
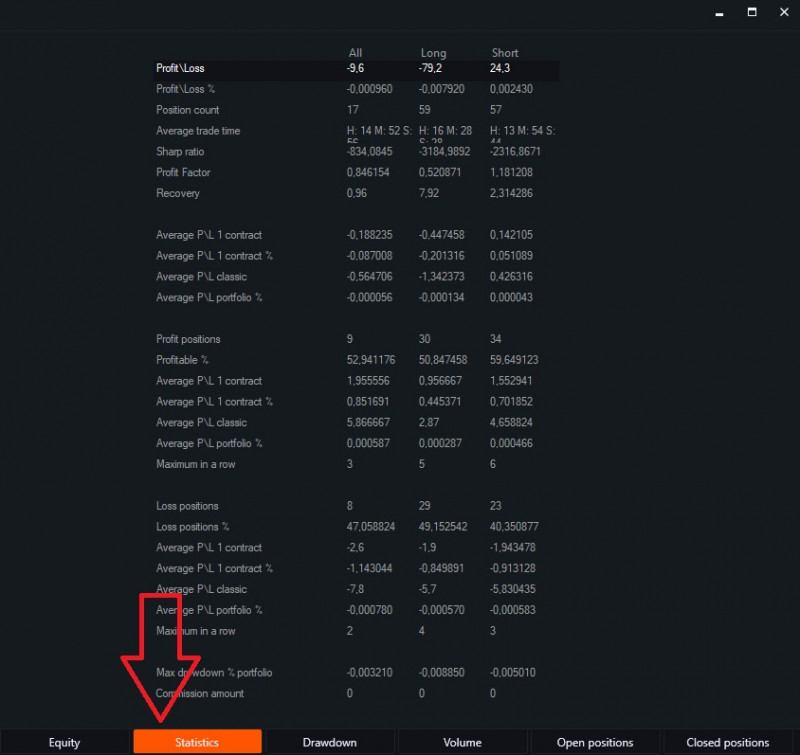
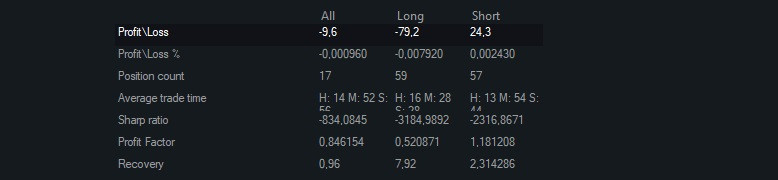
- Profit/Loss - the profit or loss resulting from all operations.
- Profit/Loss % - the profit or loss percentage relative to the capital.
- Position count - ...
- Average trade time - the arithmetic mean of the position holding time.
- Sharp ratio - a measure of the efficiency of an investment portfolio, calculated as the ratio of the average risk premium to the standard deviation of the portfolio.
- Profit Factor - the ratio of the profit obtained over a certain time period to the losses.
- Recovery - shows how much the profit exceeds the depth of the maximum drawdown.
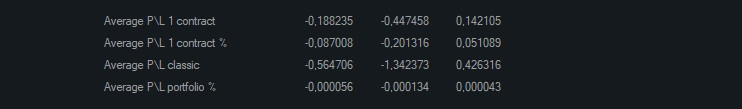
- Average P/L 1 contract - the averaged value of the profit from the movement in absolute terms without taking volume into account. Only the instrument's movement from entry to exit.
- Average P/L 1 contract % - the averaged value of the profit from the movement in percentage terms without taking volume into account. Only the instrument's movement from entry to exit.
- Average P/L classic - the averaged value of the profit from the movement in absolute terms taking volume into account.
- Average P/L % portfolio - the averaged value of the profit from the movement in percentage terms taking volume into account, calculated relative to the previous portfolio value.
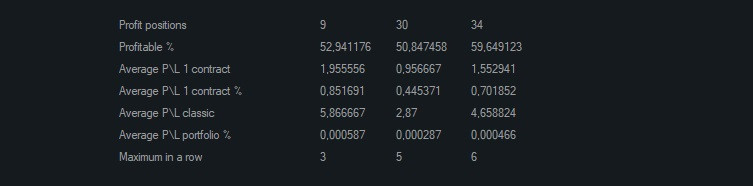
- Profit positions - ...
- Profitable % - the percentage of profitable trades out of the total number of trades.
- Average P/L 1 contract - the average movement of the instrument during the time spent in the position.
- Average P/L 1 contract % - the average movement of the instrument in percentage during the time spent in the position.
- Average P/L classic - the average profit from the position.
- Average P/L portfolio % - the average profit from the position relative to the portfolio.
- Maximum in a row - the number of consecutive profitable positions.
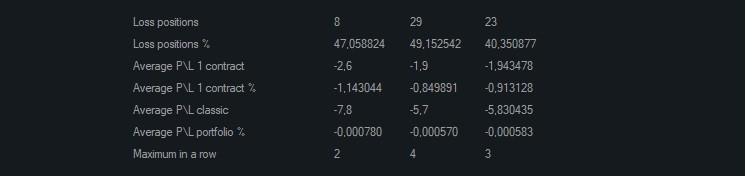
- Loss positions - ...
- Loss positions % - percentage of losing trades out of the total number of trades.
- Average P/L 1 contract - the average movement of the instrument during the time we hold the position.
- Average P/L 1 contract % - the average movement of the instrument in percentage during the time we hold the position.
- Average P/L classic - the average loss from a position.
- Average P/L portfolio % - the average loss from a position in relation to the portfolio.
- Maximum in a row - the number of consecutive losing positions.
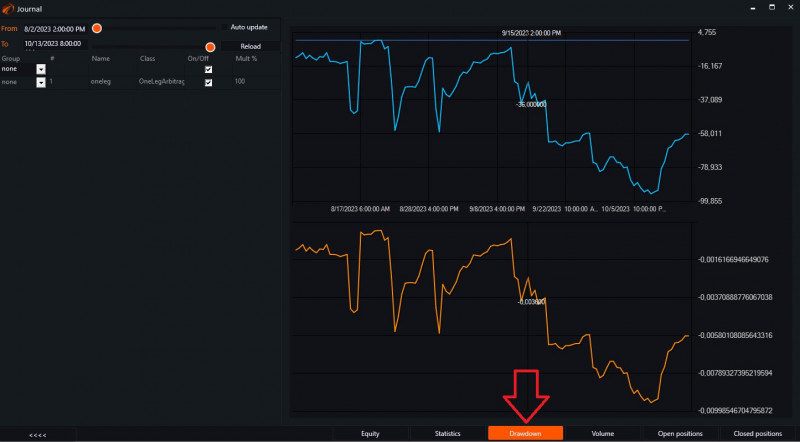
Drawdown.
This tab shows the dynamics of drawdown changes during the trading period.
Volume.
This tab shows the maximum tradable volume:
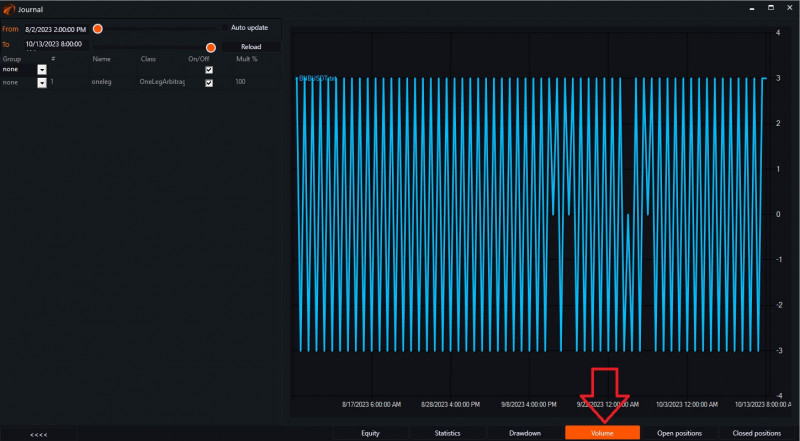
This tab will be useful for controlling and monitoring trading volumes. It is very convenient when multiple different trading algorithms are connected and trading is conducted on various instruments.
Open positions.
This tab shows the current open positions that the bot is currently managing:
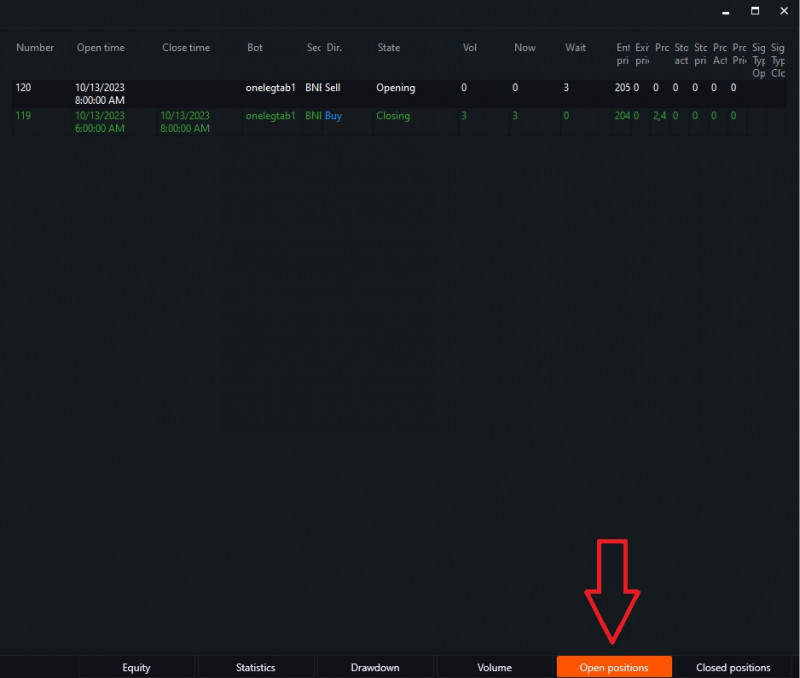
- Number - the current trade number in the system.
- Opening time - the date and time of the trade opening.
- Closing time - the date and time of the trade closing.
- Bot - the name of the tab that executes trades.
- Security - the name of the instrument.
- Direction - the direction of the trade (Buy or Sell).
- State - the current state of the trade.
- Vol - the volume of the trade that the bot should enter the market with.
- Now - the executed volume.
- Wait - the volume not yet executed, but waiting for execution.
- Enter price - the price at which the bot entered the position.
- Exit price - the price at which the bot exited the position.
- Profit - the profit margin from this trade.
- Stop activation - the activation price of the stop order. After reaching this price, an order will be placed.
- Stop price - the price at which the bot will execute the stop order.
- Profit activation - the activation price of the profit order. After reaching this price, an order will be placed.
- Profit price - the price at which the bot will execute the profit order.
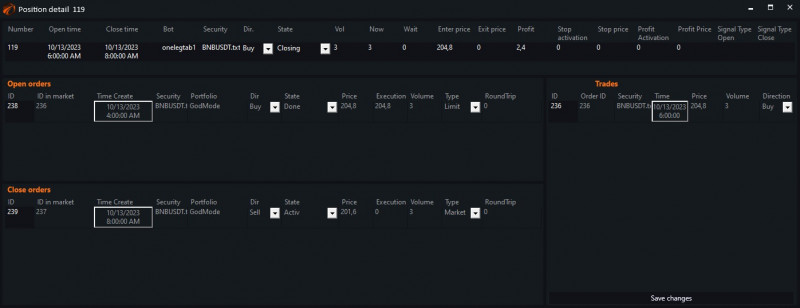
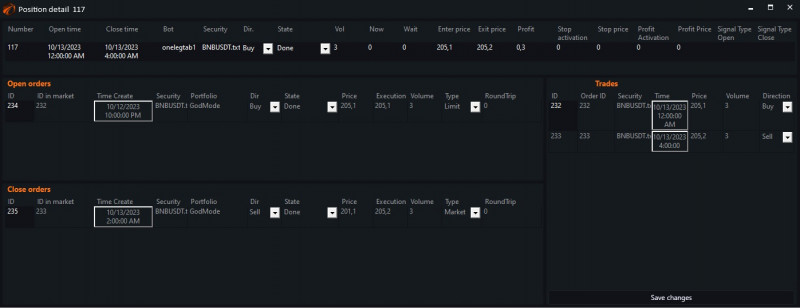
Double-clicking on the area of the current trade opens an additional «Position detali» window.
Closed positions.
This tab displays all closed trades, or in other words, a table of all executed trades:
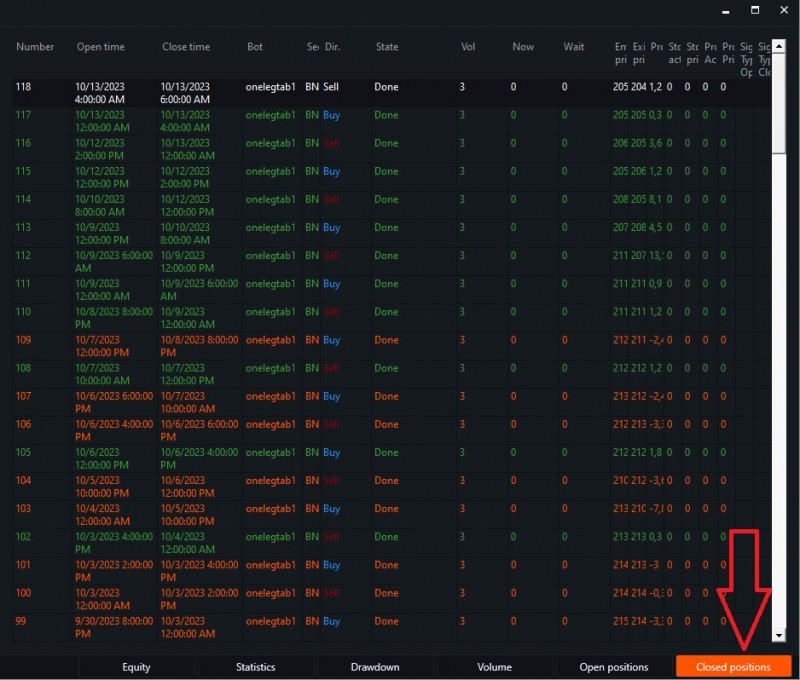
Double-clicking on a row will display full information about the position:
Individual journal.
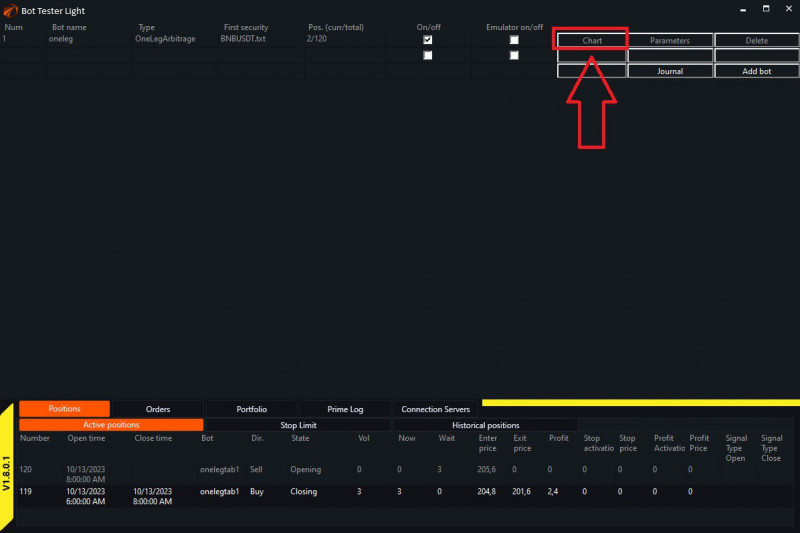
Above, we looked at the general journal. To view information for each individual bot, you need to do the following:
Click on the «Chart» button next to the bot you are interested in:
Then
- Click on «Control».
- Click on «Journal».
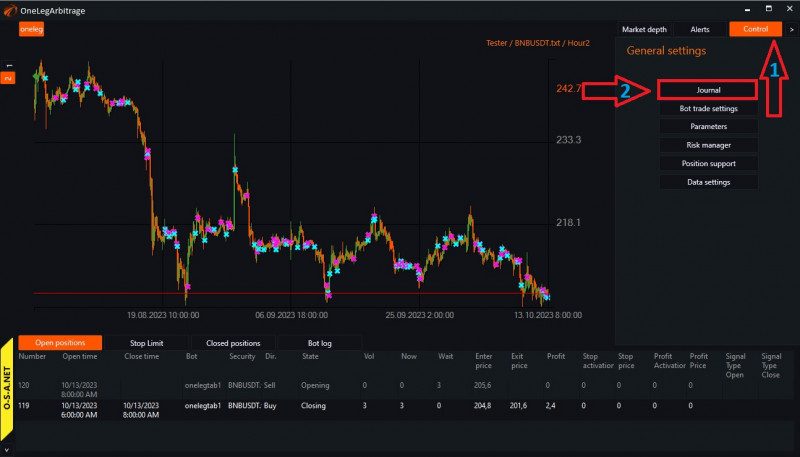
This will take you to the journal of the desired robot, where you can view information for each tab just like in the general journal:
Wishing you successful testing and profitable trading!
PS:
If something didn't work out or if you have any questions, please write to the support chat, link.