Important nuances in testing non-standard timeframes in OsEngine.

Article on how to download tick data for many years and how many resources it takes to start experiments. Also, let's talk about the tester settings to ensure everything runs smoothly.
The instructions are written using the example of the Moscow Exchange (When it comes to cryptocurrencies, it's all the same, just connecting to Binance will take five times longer and more disk space). The task is as follows:
1. Download trades from MOEX TOP from 2020. It turns out there are about 50 securities. The size in the file system is about 60 gigabytes. In the cryptocurrency market, there are also many securities, so you need to choose the top ones.
2. Ensure that it all doesn't crash due to lack of memory. This is about OsData, where a few tweaks have been made.
3. Enable the screener robot in the tester, which will simultaneously test all these securities for over 4 years in parallel tests on one portfolio, so here too, you need to ensure that nothing crashes due to lack of memory. A setting was added to the exchange emulator for this, which removes unnecessary trades from memory.
1. What should be in the end in OsData?
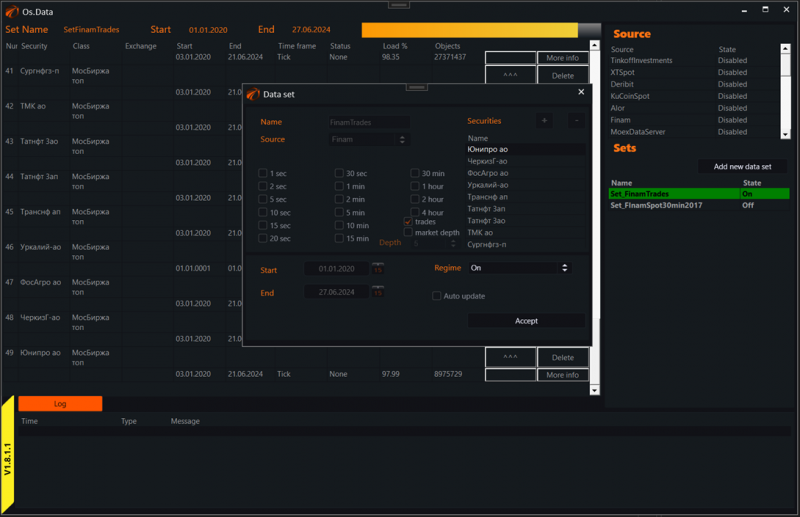
This is what the dataset we downloaded looks like.
49 securities. Only trades. Source - Finam.
If you don't know how to use OsData, click here.
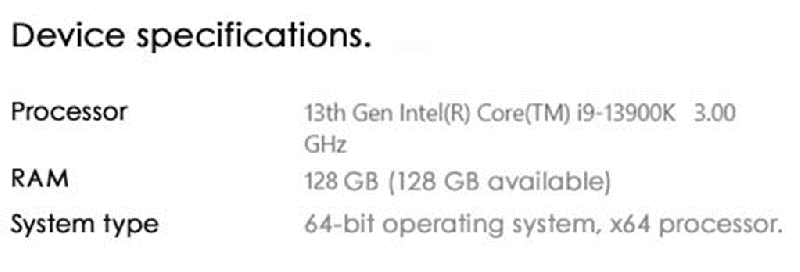
2. What PC is used for tests?
We have very serious machines in the office. As for the processor and RAM, it is likely still possible to download data on a weak machine, but it will be very difficult to conduct tests on a wide market. Here is our machine for cross-testing on tick data:
3. Don't forget to delete illiquid securities.
When the data set is downloaded, you will need to delete the excess. What to pay attention to:
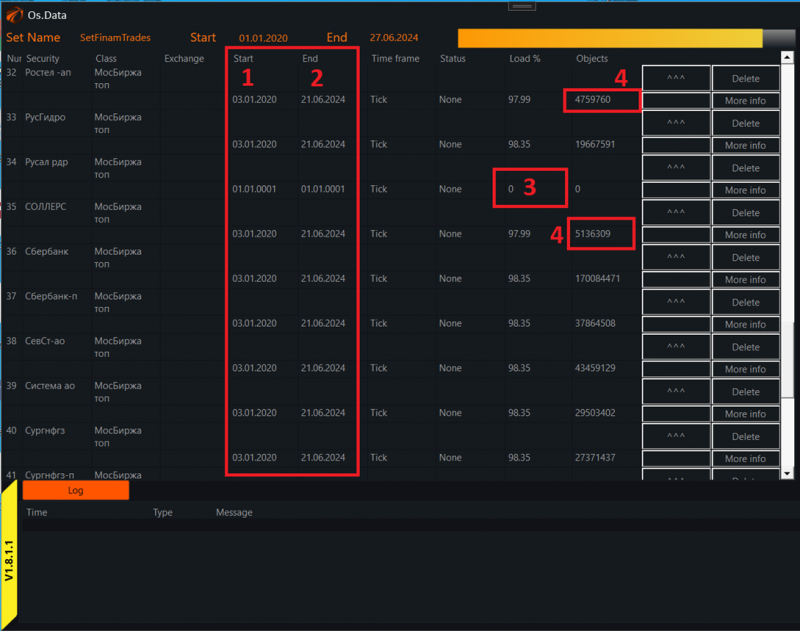
1. The Start column - the actual start of the data. Ideally, it should not differ from the neighboring securities. If it differs, the listing of the security occurred later. Delete it.
2. The End column - the actual end of the data. Ideally, it should not differ from the neighboring securities. If it differs, it means the security went through delisting at some point.
3. The Load % column - shows the percentage of data load and whether there are any gaps inside. If it's simply 0, delete. There may also be deviations. Delete those too.
4. The Objects column - shows the number of trades in the data batch. Delete visually where there are significantly fewer trades than in Sberbank. The fewer, the worse, and the less liquidity.
4. Tester. How to set up the server to avoid crashes?
In the exchange emulator, pay attention to THREE things:
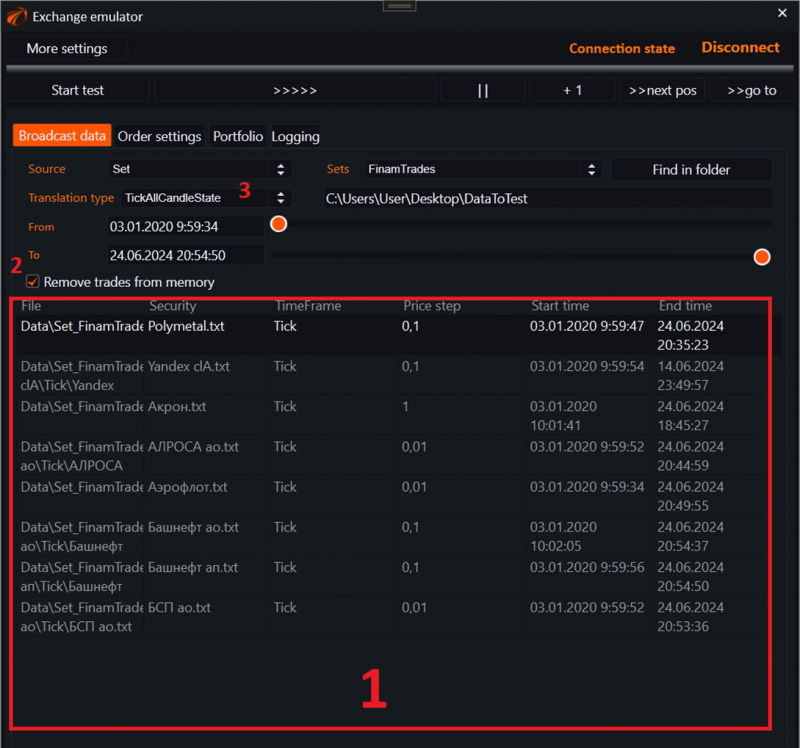
1. The data will be loaded here for some time. If you have downloaded many securities, it may take several minutes.
2. Check the "Remove trades from memory" box. This allows the tester to dynamically clear data, preventing memory overload.
3. TickAllCandleState - this transmission mode should be set during testing of non-standard candle series, otherwise there will be problems.
Good luck with the algorithms!