Example of using BotTabCluster in the robot code.

In this article, we will consider a robot that analyzes cluster charts and based on this information, performs trading operations. Let's briefly outline the technical task. Cluster analysis includes concepts of pushing and braking bars (candles). When considering bullish candles, a "pushing" bar is one where the maximum volume is located at the lower part of the candle, ideally in the lower shadow. A "braking" bar is one where the maximum volume is located at the upper part of the candle, ideally in the upper shadow. Our robot will open a long position when a pushing bullish cluster appears and close it when a pushing bearish cluster appears. For a bullish bar, we will take the selling volume as the maximum, and for a bearish one, we will take the buying volume as the maximum.
For example, the appearance of a pushing bullish candle:

Fig. 1. Pushing bullish candle.
The appearance of a pushing bearish candle:

Fig. 2. Pushing bearish candle.
The bot will also track the last 10 clusters to select the one containing the section with the maximum total volume among them.
Let's begin by examining the data fields that will be required for operation:
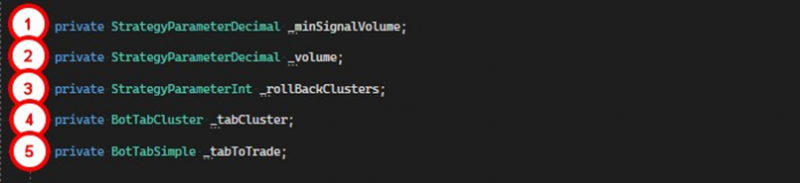
1. A parameter that sets the minimum volume that needs to be accumulated by the section for the cluster to be considered pushing or braking.
2. A volume parameter for entering a position.
3. The number of the last clusters among which the section with the maximum total volume should be found.
4. A tab for building a cluster chart.
5. A simple tab through which trading will be conducted.
Moving on to the robot's constructor:

1. Create a parameter for the signal volume.
2. Create a parameter for the trade volume.
3. Create a parameter for the number of clusters used to search for the section with the maximum total volume.
4. Create a tab for clusters.
5. Subscribe to the event of a new cluster appearing with the maximum buying volume for the cluster tab.
6. Create a simple trading tab.
7. Subscribe to the event of candle completion for the simple tab.
We will then consider auxiliary methods that act as filters.
The method PriceUpperMaxSumVolumeCluster checks whether the instrument's price has exceeded the price of the cluster with the maximum total volume over the last 10 bars (customizable parameter).

1. Retrieve the last 10 clusters from the tab and find among them the one containing the section with the maximum total volume.
2. Compare the last price for the security with the price of the section containing the maximum volume. If the price has exceeded this value, the method returns true.
3. Otherwise, the method returns false, which prevents position opening at this price.
The IsPushingClaster method checks whether the bar is pushing.

1. For opening a position, only growing candles are required, so if the bar is falling, false is returned.
2. From the cluster, retrieve the section with the maximum volume of market sales.
3. If the section's price is higher than the bar's opening price, exit, as the required volume needs to pass in the lower shadow of the candle.
4. If the line volume is less than the parameter specified, also exit.
5. If all conditions are met, this bar is considered pushing.
The IsBrakingClaster method determines whether the bar is braking.

1. Only a falling bar can be a signal to exit, so if the candle is growing, false is returned.
2. From the cluster, retrieve the section with the maximum volume of market purchases. A large number of market purchases at one level increases the probability that a large volume of limit sellers was there.
3. If the price of this line is lower than the candle's opening price, false is returned, as the required volume needs to be in the upper shadow of the bar.
4. If the line volume is less than the parameter specified, also exit.
5. If all conditions are met, this bar is considered braking.
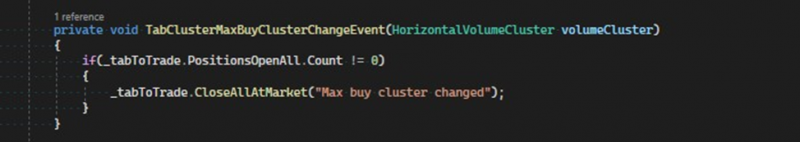
The TabClusterMaxBuyClusterChangeEvent method is an event handler for the MaxBuyClusterChangeEvent. The occurrence of this event indicates the appearance of a section with a market buying volume that exceeds the volumes of all other sections on the cluster chart. This could indicate the presence of a large limit seller, so we should close the position if one exists.
Moving on to the TabToTradeCandleFinishedEvent method, which serves as the entry point for the robot's trading logic:

1. Save a reference to the latest candle from the list of all candles.
2. Obtain the cluster profile for this candle from the list of all clusters.
3. Next, check the conditions for opening a position. If there are no open positions, the candle is pushing, and the instrument's price is higher than the price of the section with the maximum total volume over the last n candles, then open a long position.
4. If a position exists and the current candle is braking, then close the position.
The code for this robot can be found at the following link.
If you have any difficulties or questions, please write to the support chat. Link