Custom Parameters for Parameters Window Example CustomParamsUseBotSample. Table in Parameters Window.

This robot example serves as a demonstration of implementing custom parameter elements.
It shows:
1. Creating an ATR indicator in the second chart area.
2. Creating two SMA indicators on the main chart.
3. Adding a table to display indicator values in the parameter window.
4. Using the robot's parameter window to adjust elements.
Where can the robot be found in the project?
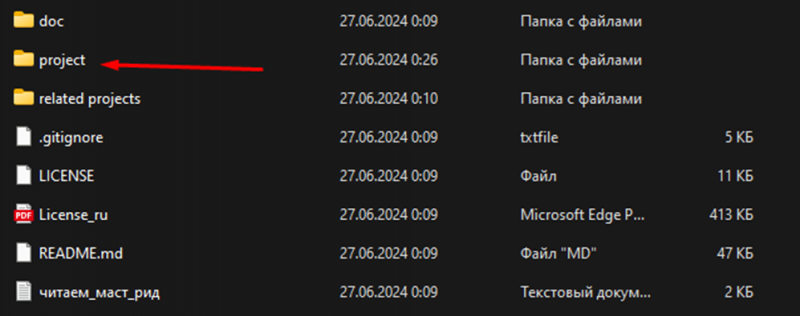
To begin with, open the project folder and go to "project".
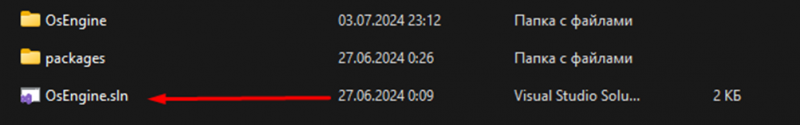
Next, open the project in Visual Studio.
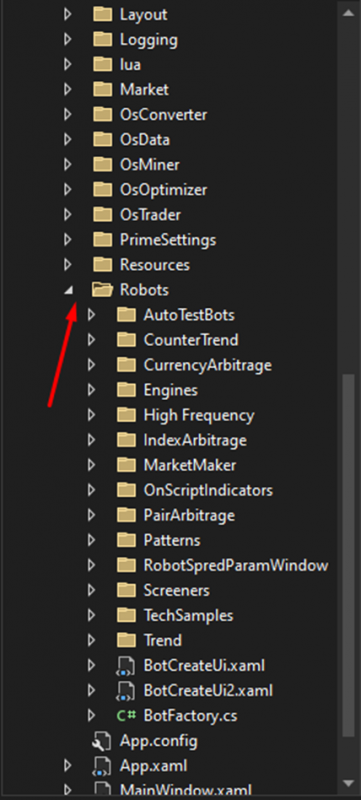
In the project, find the "Robots" folder and open it.
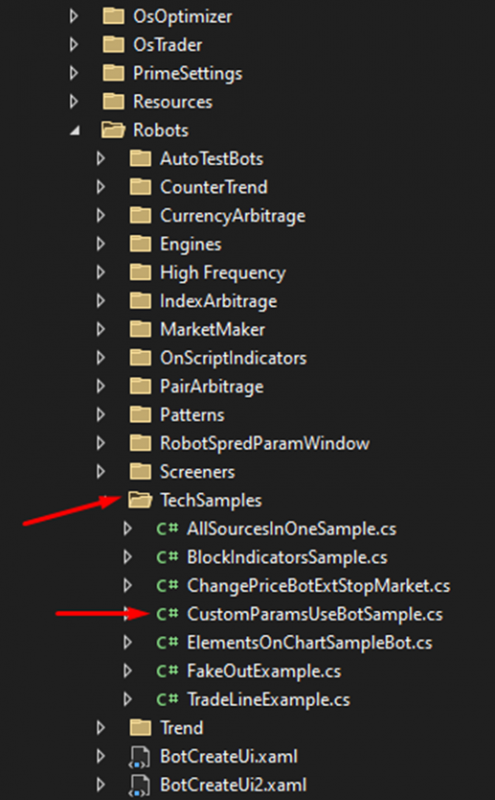
Find the folder "TechSamples" within it and select our robot "CustomParamsUseBotSample".
Breaking down the robot line by line:
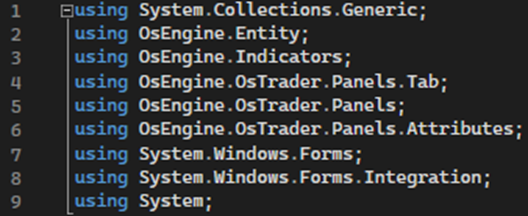
Lines 1-9:
Necessary namespaces are imported.
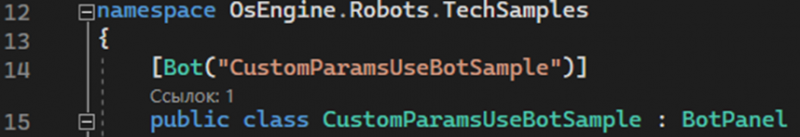
Lines 12-15:
The namespace OsEngine.Robots.TechSamples is defined to organize the code, and the class ElementsOnChartSampleBot inherits from BotPanel:
Lines 19-20:
The robot's panel is initialized.

A simple tab is created, and a reference to the tab is saved in _tab for further use.
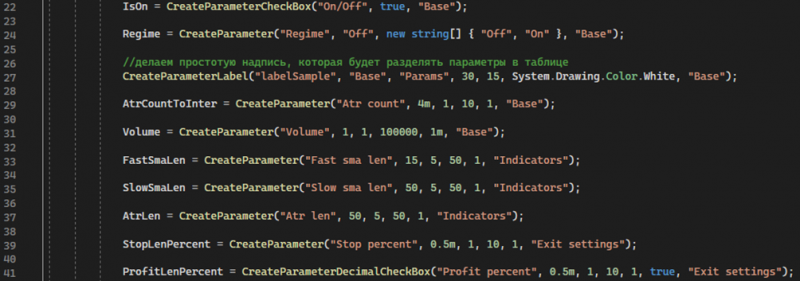
Lines 22-41:
Creating robot parameters.
Lines 43-56:
Creating indicators.
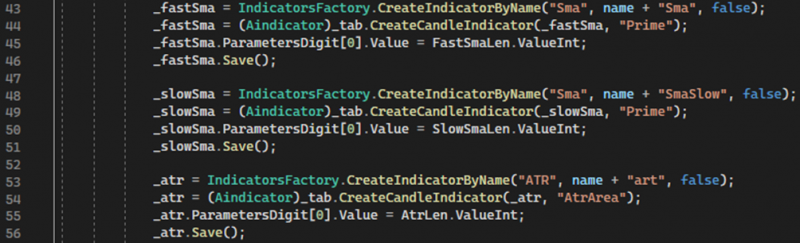
Creation and configuration of indicators: fast and slow Simple Moving Averages (SMA) and ATR.
Line 58:
Subscribing to the ParametrChangeByUser event.
![]()
This method is called when the user changes indicator parameters, updating their values.
Line 60:
Subscribing to the CandleFinishedEvent event.
![]()
Lines 64-66:
Setting up the parameter interface.

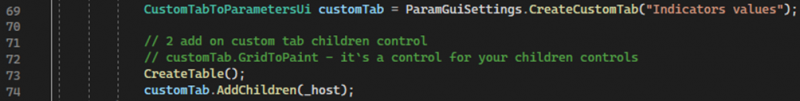
Lines 69-74:
Creating a custom tab for the indicator values.
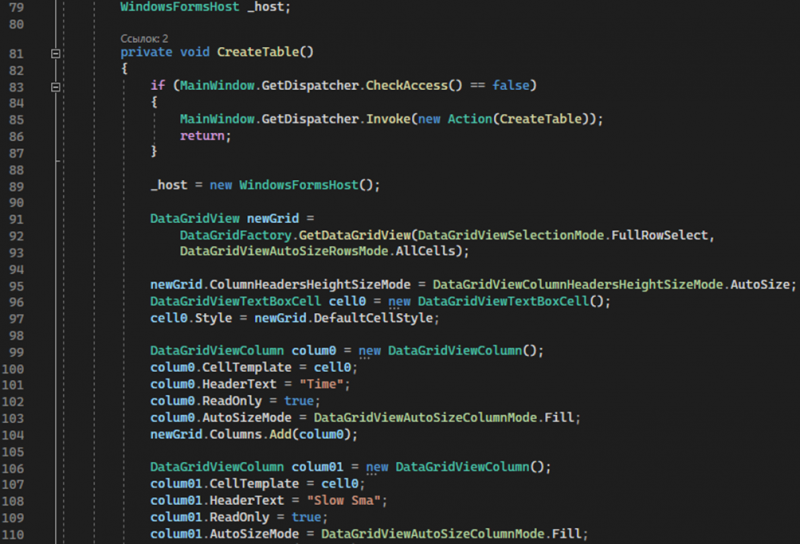
Lines 79-136:
Method responsible for creating a table of indicator values.
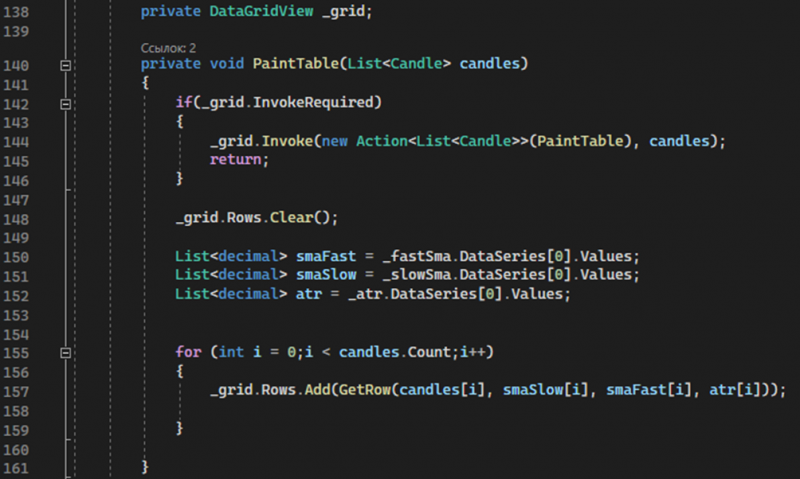
Lines 138-161:
Method responsible for updating the table values.
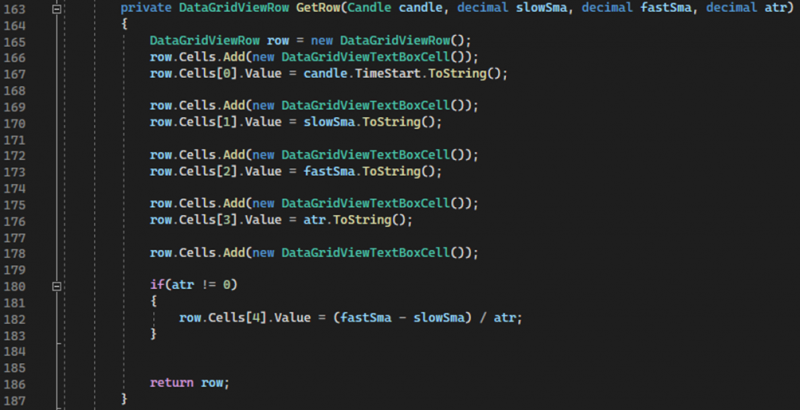
Lines 163-187:
Method that creates cells in the table for the calculated values.
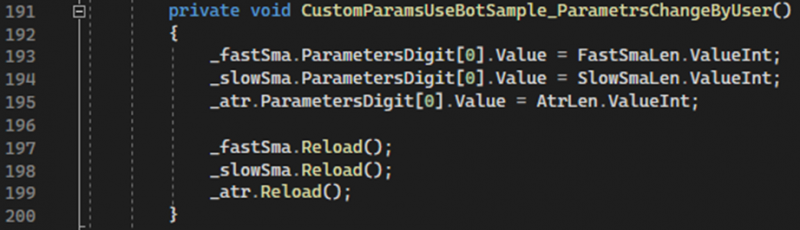
Lines 191-200:
Method for updating the indicator parameter values.
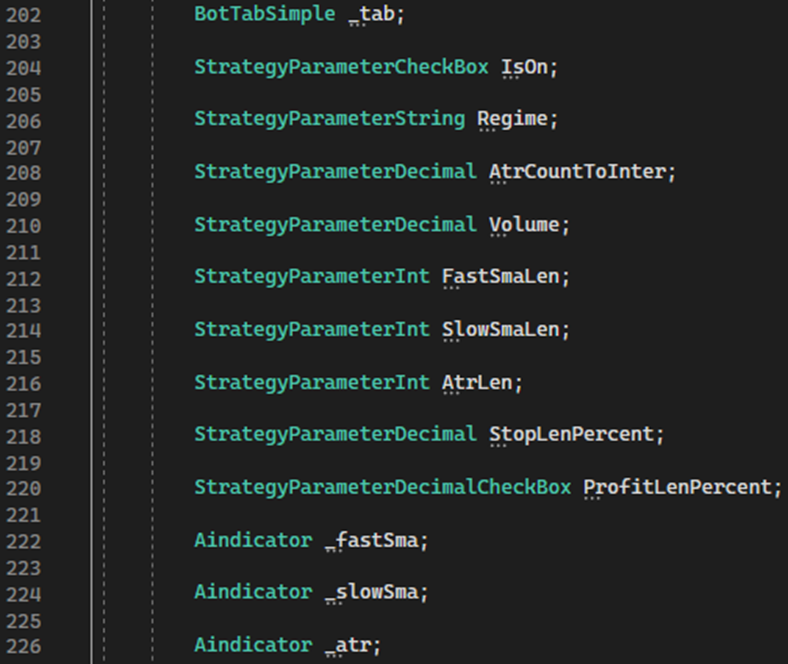
Lines 202-226:
This block defines the robot's variables.
Lines 228-236:
Overriding the GetNameStrategyType and ShowIndividualSettingsDialog methods.
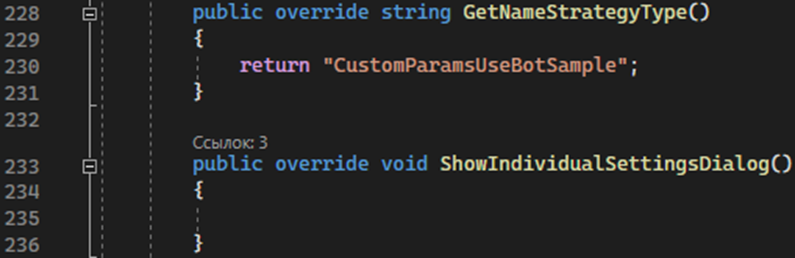
The first method returns the strategy name, the second is empty and is intended for displaying individual settings.
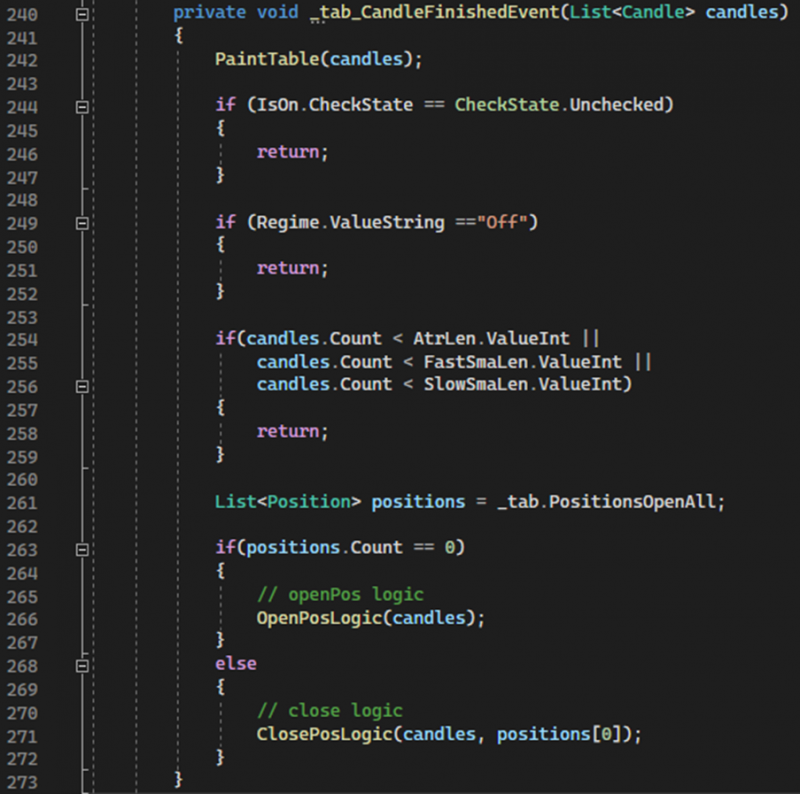
Lines 240-273:
This method, called when a new candle is formed on the chart, handles the robot's trading signals.
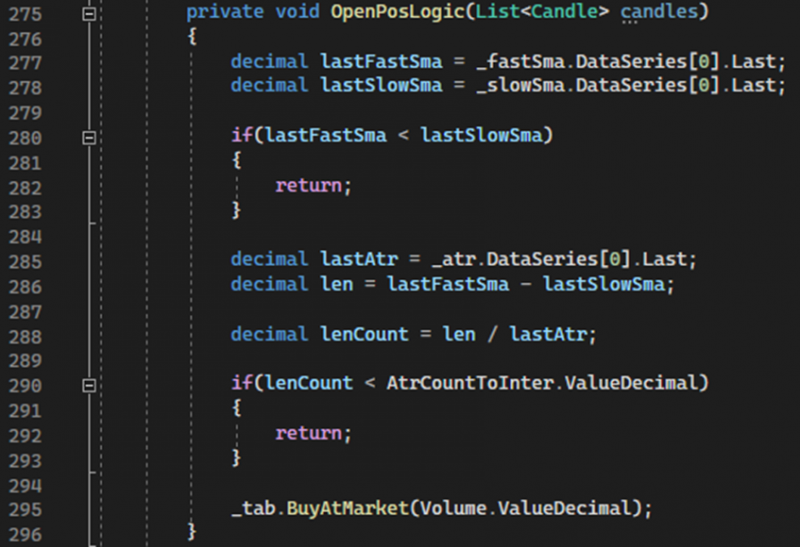
Lines 275-296:
Method for opening a position.
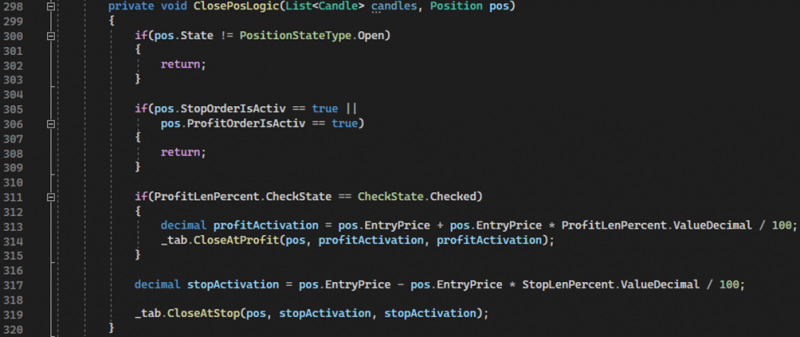
Lines 298-320:
Method for closing a position.
Description of the methods' functions:
Access the tester and run our robot, open the parameter window.
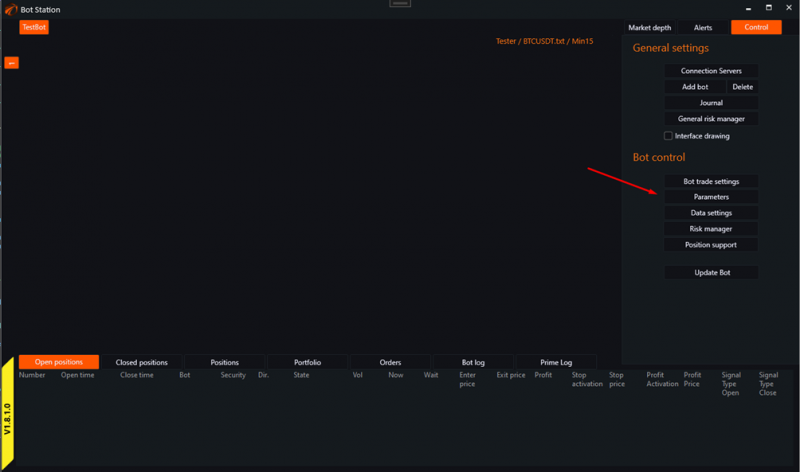
1. "Base":
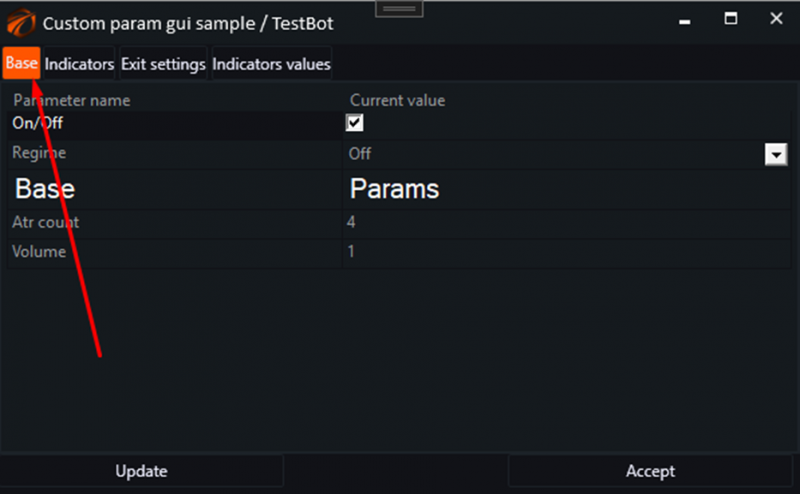
Contains basic robot settings.
2. "Indicators":
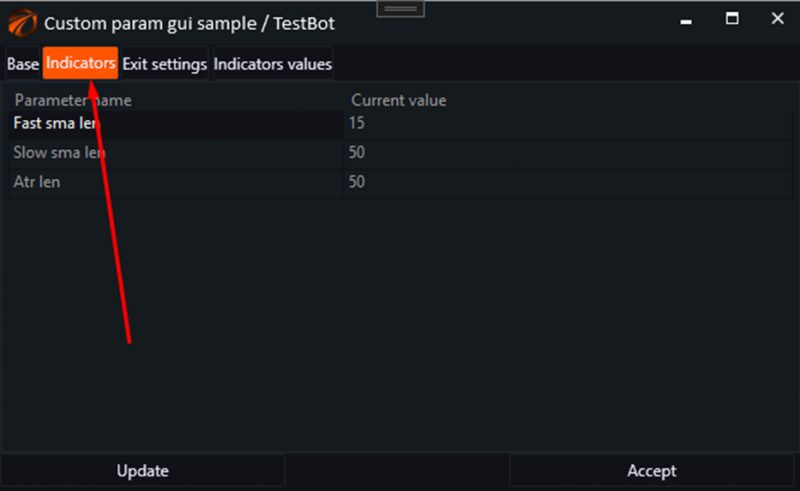
Here, we configure our indicators.
3. "Exit settings":
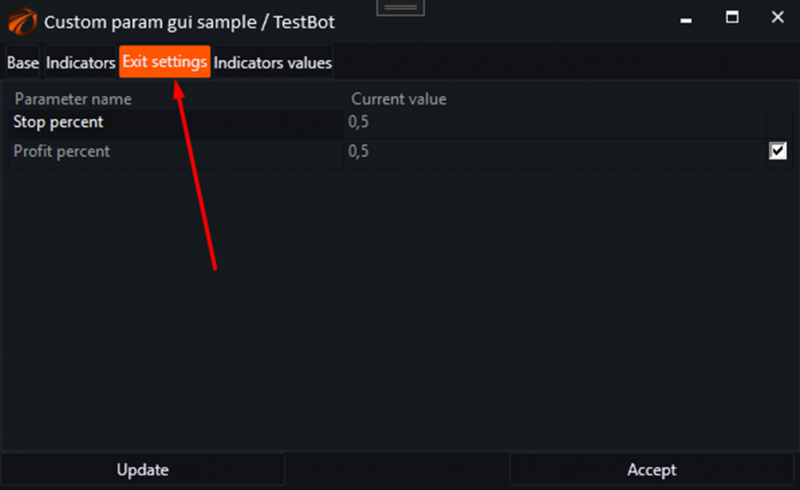
Adjustment of values for the exit logic from a position.
4. "Indicator values":
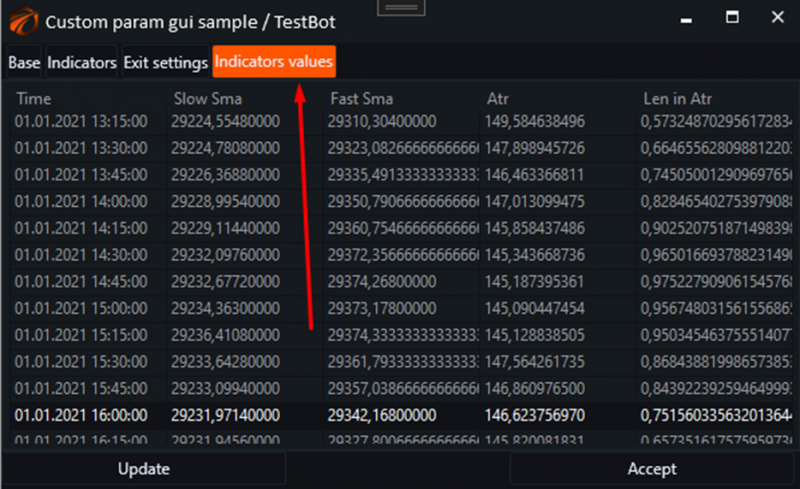
This tab contains a table of indicator values in the parameters.
To create such a table, we need the following three methods:
1. CreateTable
2. PaintTable
3. GetRow
CreateTable method:
1. The "Name" method creates a table (DataGridView) inside the WindowsFormsHost element.
2. A new WindowsFormsHost object is created and assigned to a variable.
3. A new DataGridView object is created with full row select mode (DataGridViewSelectionMode.FullRowSelect) and automatic row size adjustment using the DataGridFactory.GetDataGridView method.
4. The automatic column header resizing mode (ColumnHeadersHeightSizeMode.AutoSize) is set.
5. A DataGridViewTextBoxCell object (cell0) is created and its style is set to the default style for newGrid.
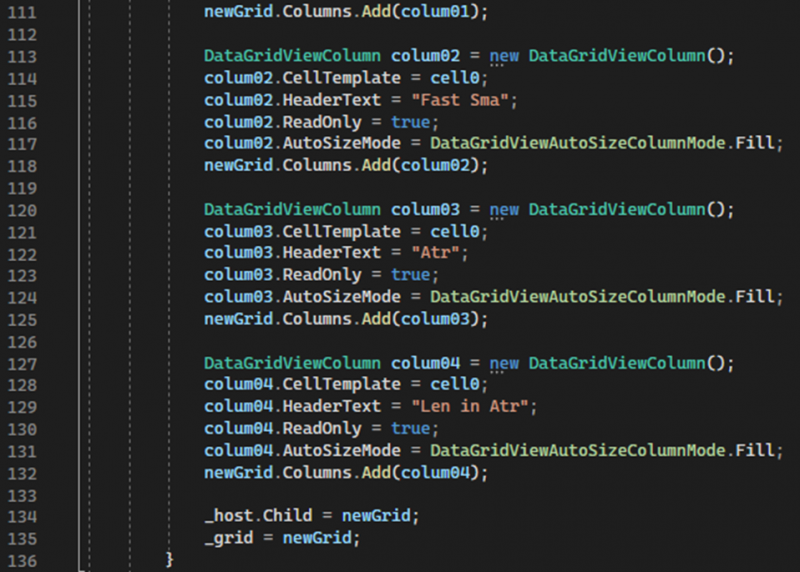
6. Five columns (DataGridViewColumn) are created and configured:
1. Time: Column to display time.
2. Slow Sma: Column to display the Slow Simple Moving Average (SMA).
3. Fast Sma: Column to display the Fast Simple Moving Average (SMA).
4. Atr: Column to display the Average True Range (ATR) value.
5. Len in Atr: Column to display the Length in ATR.
7. The following properties are set for each column:
1. CellTemplate: Sets the cell template (cell0).
2. HeaderText: Sets the text of the column header.
3. ReadOnly: Sets the property to make the column read-only.
4. AutoSizeMode: Sets the mode for automatically resizing the column.
8. All created and configured columns are added to the DataGridView (newGrid.Columns.Add).
9. The Child property of the host object is set equal to the created DataGridView (newGrid).
10. The reference to the created DataGridView is saved in a variable.
PaintTable Method:
1. Updates the table using candle and indicator data.
2. Clears all rows in the table to prepare for adding new data.
3. Extracts values of the fast simple moving average, slow simple moving average, and ATR from the corresponding indicator data series.
4. Iterates through all candles in the list.
5. For each candle, calls the GetRow method, which returns a data row to add to the table. The current candle and corresponding values of slow simple moving average, fast simple moving average, and ATR are passed to the method.
6. Adds the retrieved row to the table (grid.Rows.Add).
GetRow Method:
1. Creates and returns a row for the table based on candle data and indicator values (slow and fast simple moving averages, ATR).
2. A new object of type DataGridViewRow is created.
First Cell:
1. Creates a new DataGridViewTextBoxCell object.
2. Sets the value of the candle start time into the cell.
Second Cell:
1. Creates a new DataGridViewTextBoxCell object.
2. Sets the value of the slow simple moving average into the cell.
Third Cell:
1. Creates a new DataGridViewTextBoxCell object.
2. Sets the value of the fast simple moving average into the cell.
Fourth Cell:
1. Creates a new DataGridViewTextBoxCell object.
2. Sets the value of ATR into the cell.
Fifth Cell:
1. Creates a new DataGridViewTextBoxCell object.
2. If the ATR value is not zero, the calculated difference between the fast and slow moving averages divided by ATR is added to the cell.
3. Returns the filled row to be added to the DataGridView table.
Conclusion: This robot example will be useful to demonstrate how to create and customize custom elements in the robot's parameter window. It shows how to add and configure indicators on the chart, as well as how to create a table for displaying indicator values, which can serve as a ready-made template for implementing similar tasks.