"Custom Chart Elements" for OsEngine. Analysis of the ElementsOnChartSampleBot example line by line.

This example of a robot serves as a demonstration of implementing custom elements on the chart using the robot's parameters window.
It shows:
1. Creating an MACD indicator on the second chart area.
2. Adding buttons for various actions with chart elements (adding points, lines, segments, trendlines).
3. Handling button click events and interacting with chart elements.
4. Using the robot's parameters window to configure elements.
Where to find the robot in the project?
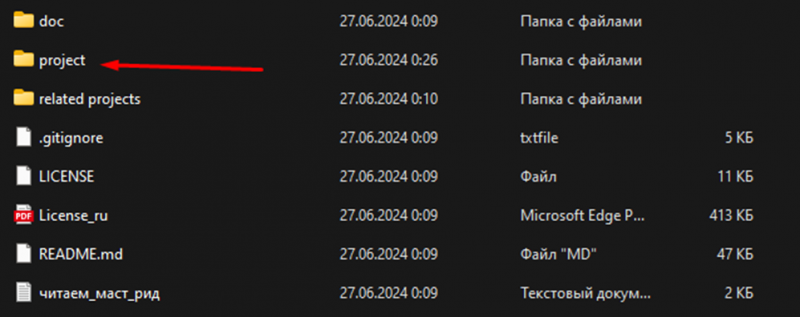
To start, open the project folder and go to "project."
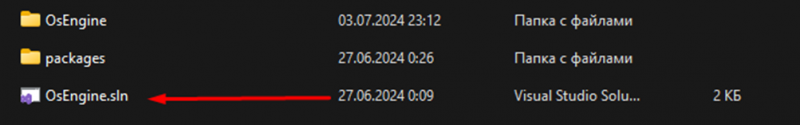
Then open the project in Visual Studio.
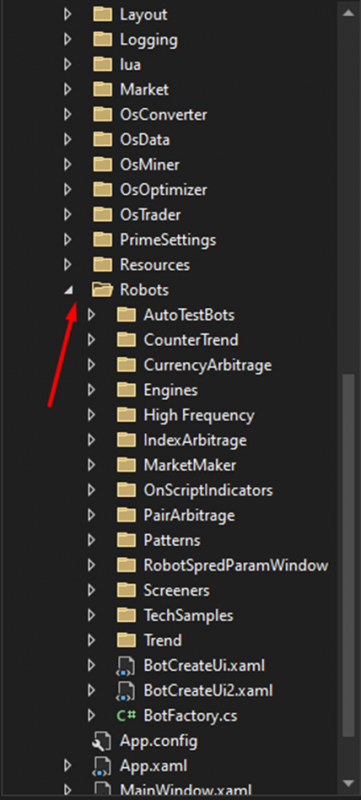
Find the "Robots" folder in the project and open it.
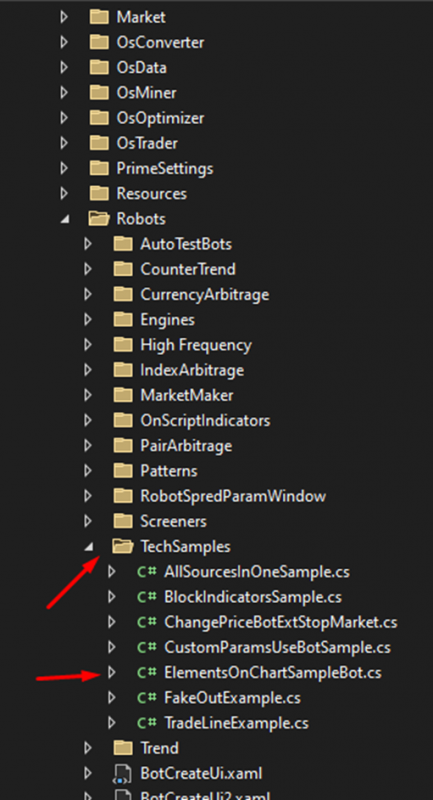
Finally, find the "TechSamples" folder, and there select our robot, "ElementsOnChartSampleBot."
Robot breakdown line by line.
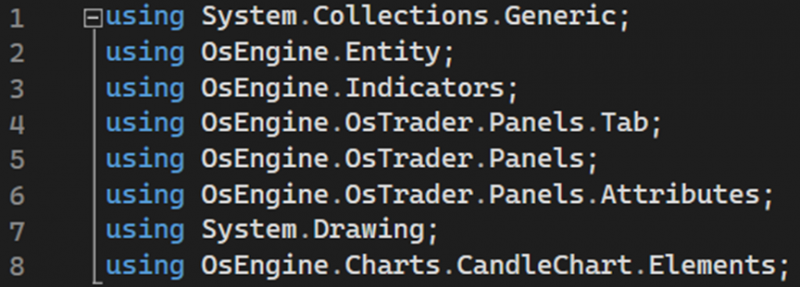
Lines 1-8:
Necessary namespaces are imported.
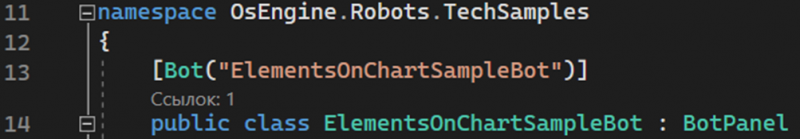
Lines 11-14:
The namespace OsEngine.Robots.TechSamples is defined to organize the code, and the class ElementsOnChartSampleBot inherits from BotPanel.
Lines 19-20:
The robot panel is initialized.

A simple tab is created, and a reference to the tab is saved in _tab for further use.
Line 21:
Subscribes to the CandleFinishedEvent event.
![]()
Lines 24-26:
An MACD indicator is created in the second chart area ("MacdArea").

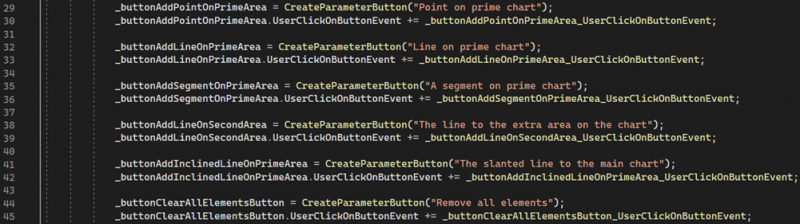
Lines 29-45:
Buttons are created to add various chart elements.
Lines 49-57:
Overrides the GetNameStrategyType and ShowIndividualSettingsDialog methods.
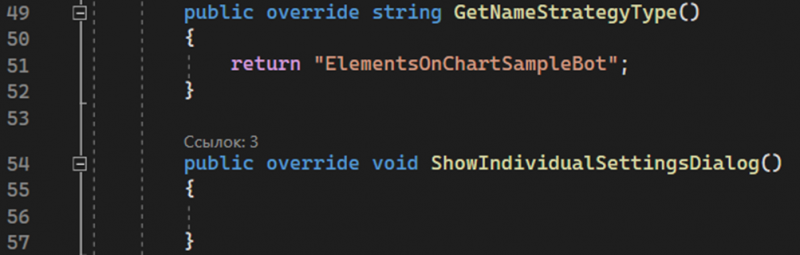
The first method returns the strategy name, and the second - an empty method - is for displaying individual settings.
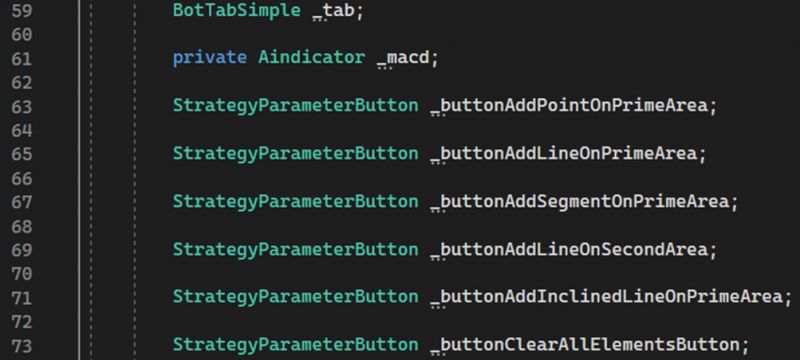
Lines 59-73:
Class fields are declared to store the tab, indicator, and buttons.
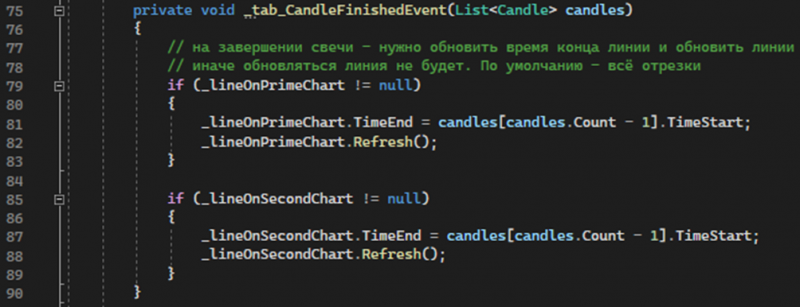
Lines 75-90:
Candle completion event handler. Updates the end time of lines on the chart and redraws them.
Button handlers:
Lines 94-131:
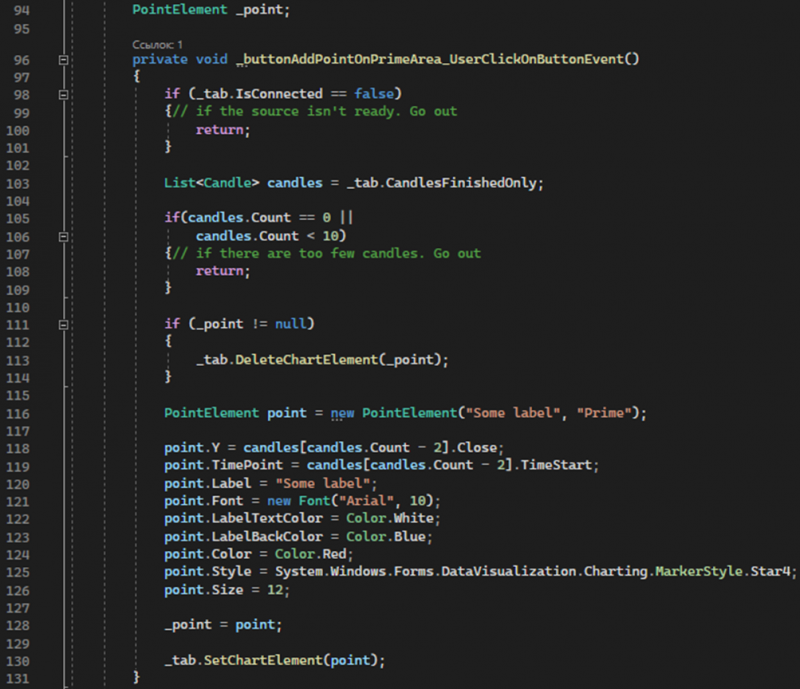
Button click event handler to add a point to the main chart. Checks tab readiness and the availability of an adequate number of candles. Creates and adds a point element to the chart.
Lines 133-172:
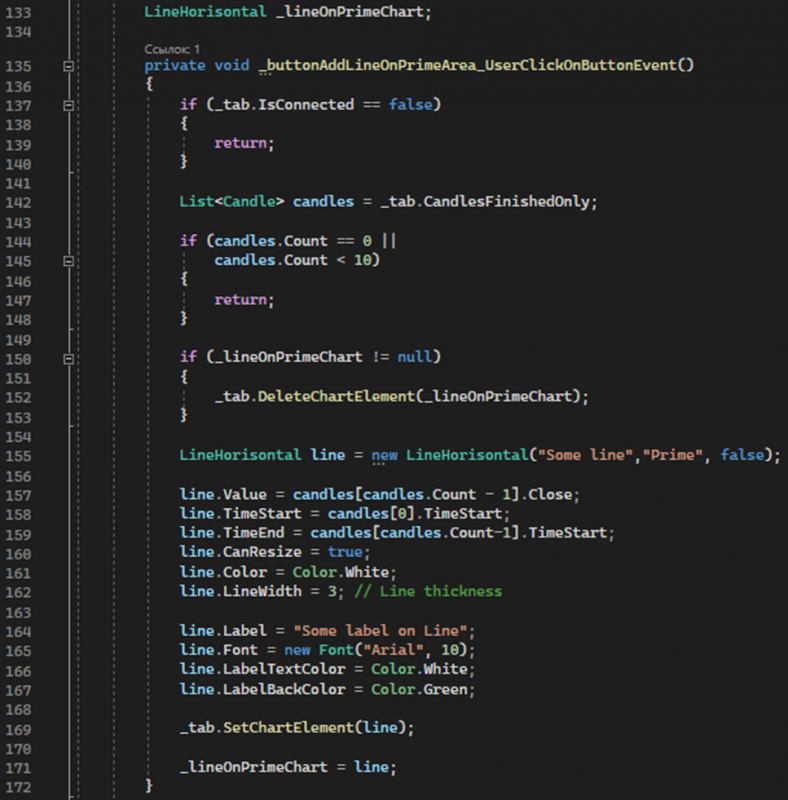
Button click event handler to add a horizontal line to the main chart. Checks tab readiness and the availability of an adequate number of candles. Creates and adds a horizontal line to the chart.
Lines 174-209:
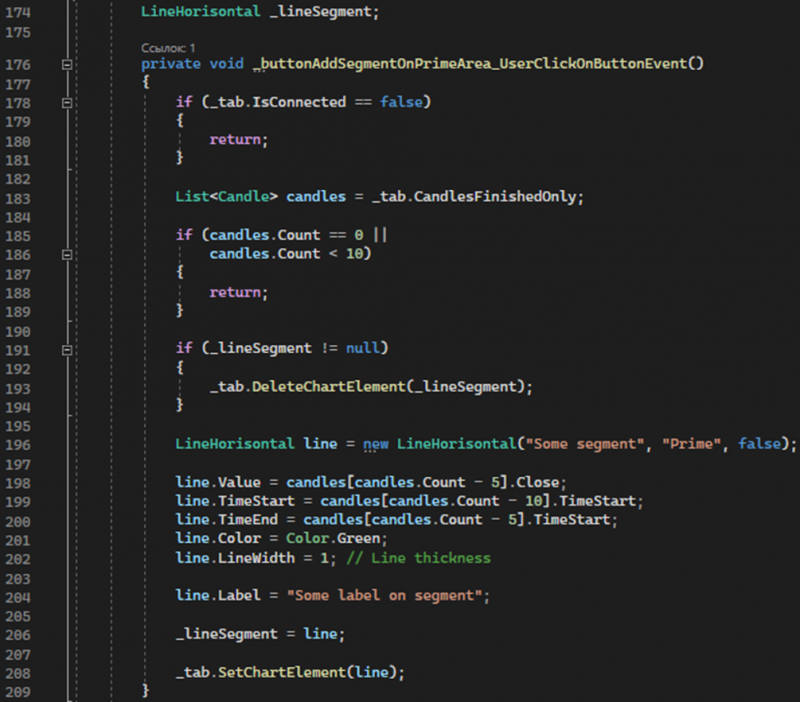
Button click event handler to add a horizontal segment to the main chart. Checks tab readiness and the availability of an adequate number of candles. Creates and adds a segment to the chart.
Lines 211-247:

Button click event handler to add a line to an additional area of the chart. Checks tab readiness and the availability of an adequate number of candles. Creates and adds a line to the additional area of the chart.
Lines 249-286:
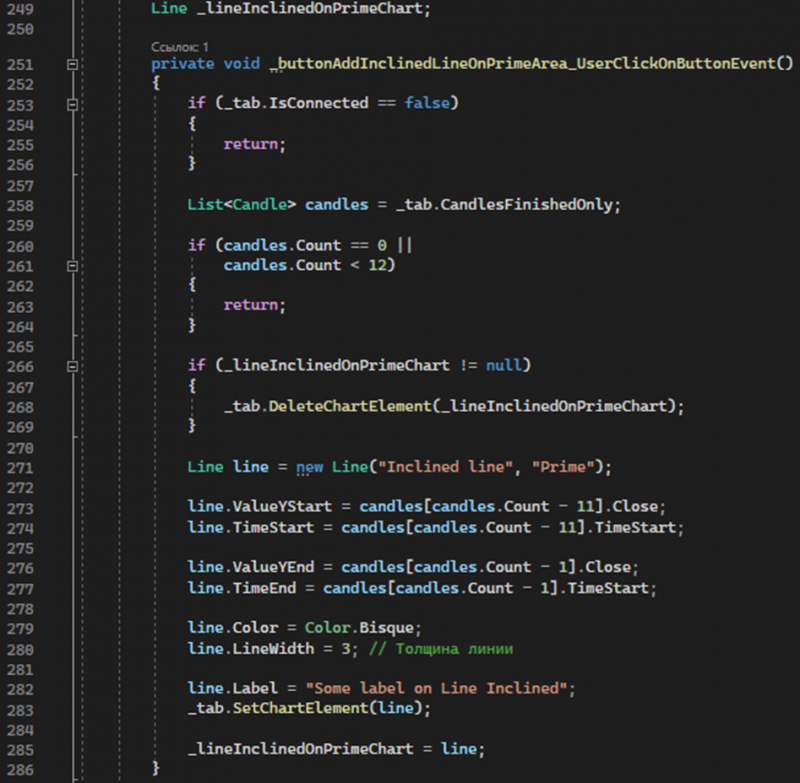
Button click event handler to add an inclined line to the main chart. Checks tab readiness and the availability of an adequate number of candles. Creates and adds an inclined line to the chart.
Lines 288-296:
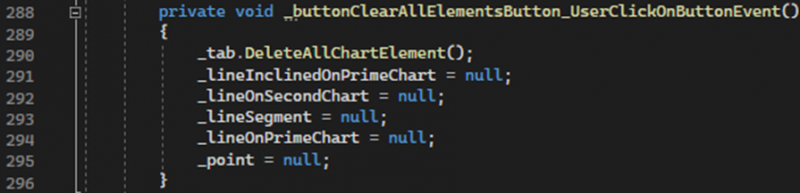
Button click event handler to clear all elements from the chart. Calls the ClearChart method to clear the chart.
Method description:
Enter the tester and run our robot, open the parameters window.
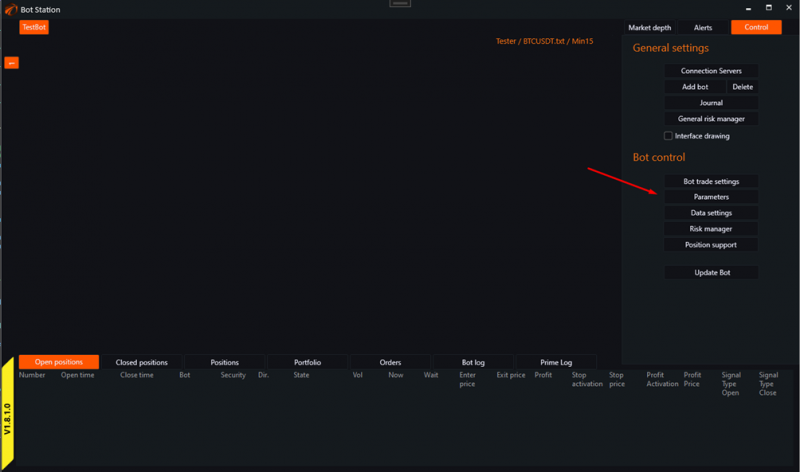
Parameters window view:
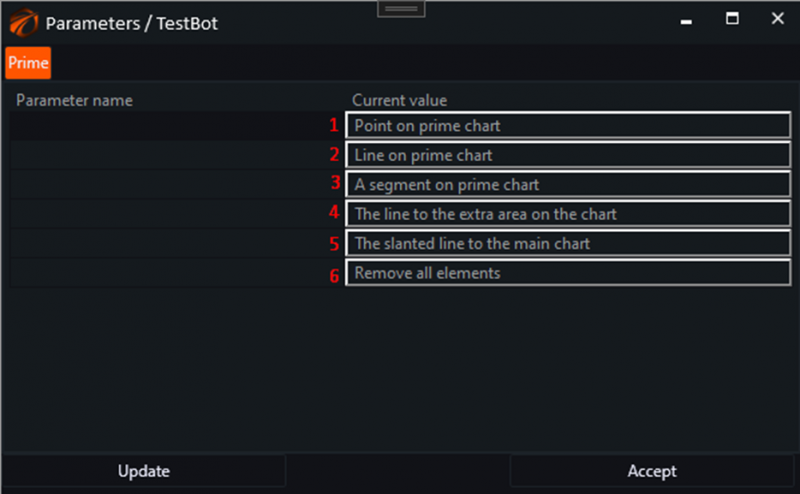
1. The "Point on prime chart" method handles the user's button click and performs the following actions:
1. Checks if there is a connection to the data source. If not, it quits.
2. Extracts the list of completed candles. If there are fewer than 10 candles or no candles, it quits.
3. Removes the previous point on the chart if it exists.
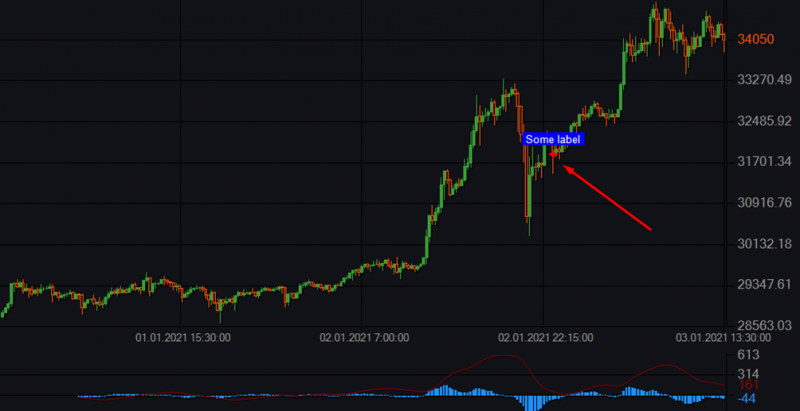
4. Creates a new point based on the data of the penultimate candle, setting different visual properties (coordinates, labels, colors, style, and size).
5. Adds the created point to the chart and saves it for possible removal in the future.
Example:
2. The "Line on prime chart" method handles the user's button click and performs the following actions:
1. Checks if there is a connection to the data source. If not, it quits.
2. Receives a list of completed candles. If there are fewer than 10 candles or no candles, the method stops working.
3. If there is a previous horizontal line, it is removed from the chart.
4. A new horizontal line is created with the following properties:
1. The line value is set based on the closing price of the last candle.
2. The start and end times of the line are set from the first to the last candle.
3. The line is configured for resizing, its color and thickness are set.
4. A label for the line, label font, text color, and label background color are set.
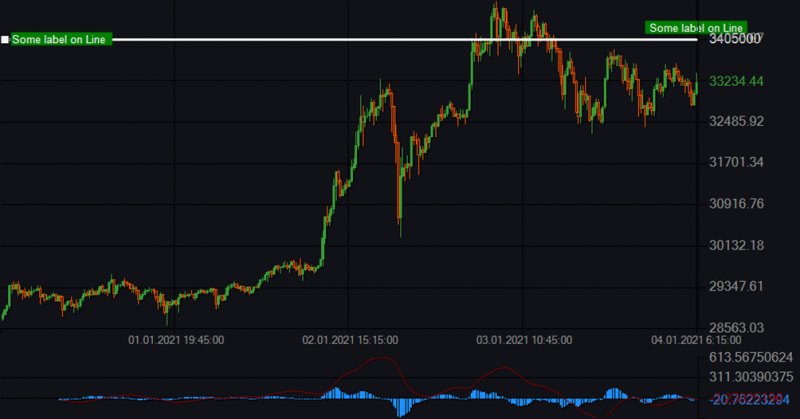
5. The new horizontal line is added to the chart.
6. A reference to the created line is saved for possible future deletion or modification.
Example:
3. The method "A segment on the prime chart" handles the user's button click event to add a segment (line) to the chart.
1. Checks if there is a connection to the data source. If there is no connection, the method stops execution.
2. Retrieves a list of completed candles. If there are fewer than 10 candles or no candles, the method stops working.
3. Checks if a segment already exists on the chart. If a segment exists, it is removed from the chart.
4. Creates a new object of type LineHorizontal with specified parameters:
1. The line value is set based on the closing price of the fifth candle from the end.
2. The start time is set based on the start time of the tenth candle from the end.
3. The end time is set based on the start time of the fifth candle from the end.
4. The line color and thickness are set.
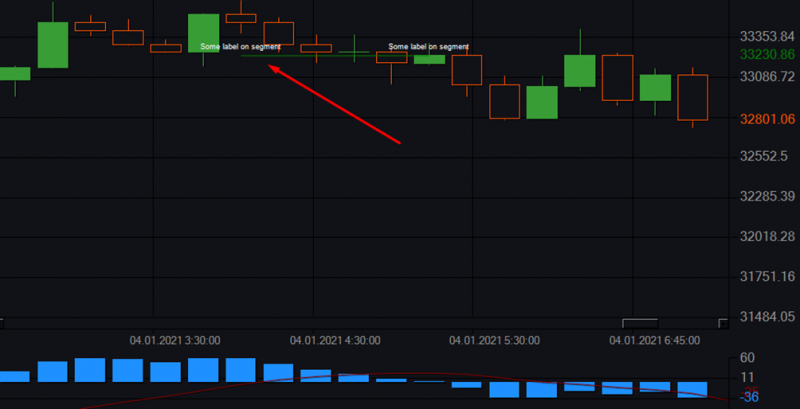
5. A label for the segment is set.
5. The new segment is added to the chart.
6. A reference to the created segment is saved for possible future deletion or modification.
Example:
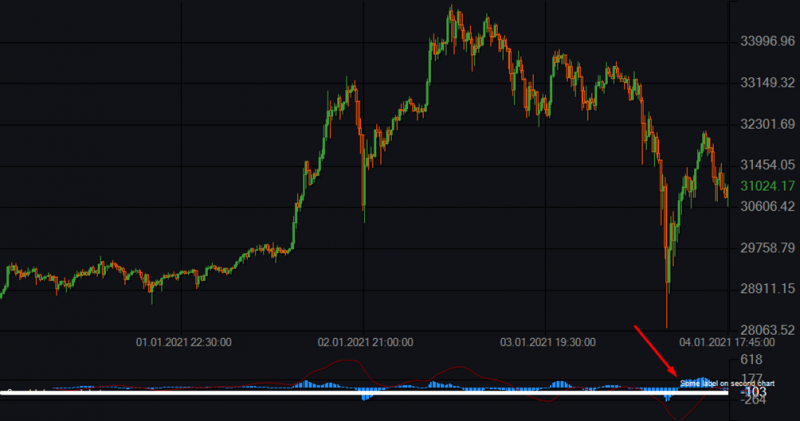
4. The method "The line to the extra area on the chart" handles the user's button click to add a horizontal line to the second area of the chart.
1. Checks if there is a connection to the data source. If there is no connection, the method stops execution.
2. Retrieves a list of completed candles from the data source.
3. Checks if there are at least 10 candles in the list. If there are fewer than 10 candles or no candles at all, the method stops execution.
4. If a line already exists on the chart, it is removed from the chart.
5. A new object of type LineHorizontal with the name "Some line on the second area" is created and attached to the chart area "MacdArea".
6. Properties of the new line are set:
1. Value: The line value is set based on the last value from the first MACD data series.
2. TimeStart: The start time of the line is set based on the start time of the first candle.
3. TimeEnd: The end time of the line is set based on the start time of the last candle.
4. Color: The line color is set to white.
5. LineWidth: The line thickness is set to 5.
6. Label: The label for the line is set to "Some label on the second chart".
7. The new line is added to the chart.
8. A reference to the created line is saved for possible future deletion or modification.
Example:
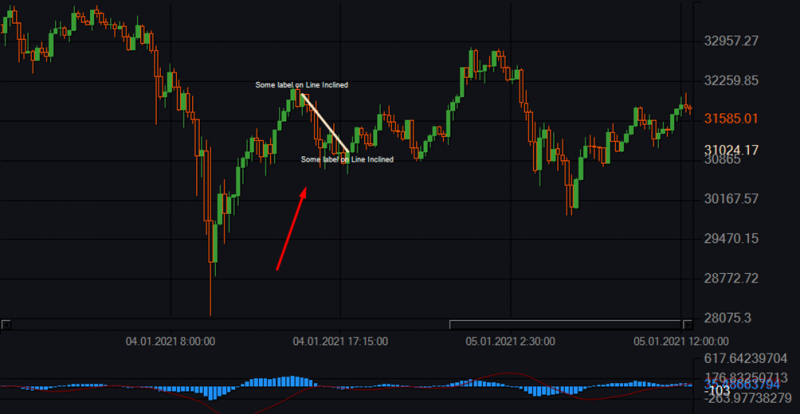
5. The method "The slanted line to the main chart" handles the user's button click to add a slanted line to the chart.
1. Checks if there is a connection to the data source. If there is no connection, the method stops execution.
2. Retrieves a list of completed candles from the data source.
3. Checks if there are at least 12 candles in the list. If there are fewer than 12 candles or no candles at all, the method stops execution.
4. If a slanted line already exists on the chart, it is removed from the chart.
5. Creates a new object of type Line with the label "Inclined line" and attachment to the "Prime" chart area.
6. Properties of the new line are set:
1. ValueYStart: The Y value at the start of the line is set based on the closing price of the 11th candle from the end.
2. TimeStart: The start time of the line is set based on the start time of the 11th candle from the end.
3. ValueYEnd: The Y value at the end of the line is set based on the closing price of the last candle.
4. TimeEnd: The end time of the line is set based on the start time of the last candle.
5. Color: The line color is set to Bisque.
6. LineWidth: The line thickness is set to 3.
7. Label: The label for the line is set as "Some label on Line Inclined".
7. The new line is added to the chart.
8. A reference to the created line is saved for possible future deletion or modification.
Example:
6. The method "Remove all elements" processes the event of the user pressing a button to remove all elements from the chart and reset the variables storing references to the created elements.
1. A method is called to remove all the elements shown above from the chart.
2. The variables storing references to the created elements are set to null:
1. _lineInclinedOnPrimeChart_lineOnSecondChart
2. _lineSegment
3. _lineOnPrimeChart
4. _point
Conclusion: the "ElementsOnChartSampleBot" example will be useful for implementing your ideas as a ready-made template. This robot demonstrates how to create and interact with different elements on the chart using the robot's parameters window.