Candles. Class Candle.

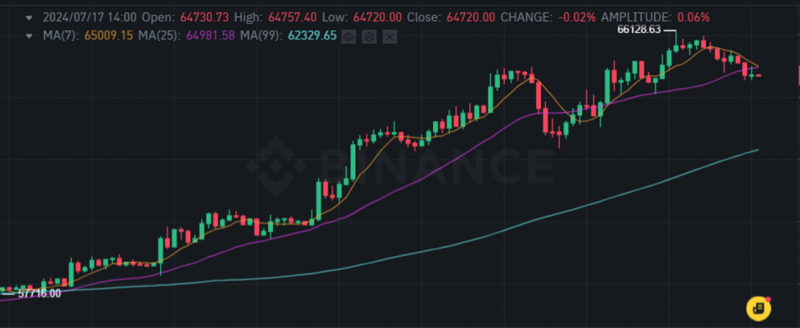
Let's talk about candles. In your web terminal, you can see them somewhat like in the image above.
1. What are Candles?
A candle is represented as a vertically oriented rectangle, from which lines extend upwards and downwards, referred to as shadows. Essentially, each candle is an aggregator of information about price behavior over a specific time interval.
Most commonly, you see Japanese candles on the chart. We will discuss these below. However, there are many types of candles, and we have a separate section called Candle Factory dedicated to them.
2. How Does the Exchange Collect Japanese Candles?
Step One: Choosing the Price Source.
For the prices from which candles can be formed, several different types of data are used. These can include:
1. Trade feed prices from trades executed on the exchange. In this case, candles are constructed from the non-personalized trade table.
2. Order book prices. Sometimes candles are built from the center of the order book. This is often necessary. For example, in some markets, trade feed data is unavailable (like Forex), or market liquidity is too low to build candles from the trade feed. However, the center of the order book, including bids and asks, is usually available.
Step Two: Choosing the Candle Length in Time.
This is called selecting the Timeframe. In English, it’s TimeFrame. This is the time interval over which we will distribute the instrument prices within the candle.
5 minutes, 15 minutes, 1 hour, 1 day, etc.
Step Three: Distributing Prices within the Candle.
Next, we need to distribute prices within the candle by marking four points: Open, High, Low, Close. Also known as: Opening, Peak, Bottom, Closing. Or, in layman's terms, OHLC. Furthermore, if the candles are built from trade feed data, we can concurrently calculate the volume that occurred during the period. In that case, it becomes OHLCV.
Key Components of a Japanese Candle:
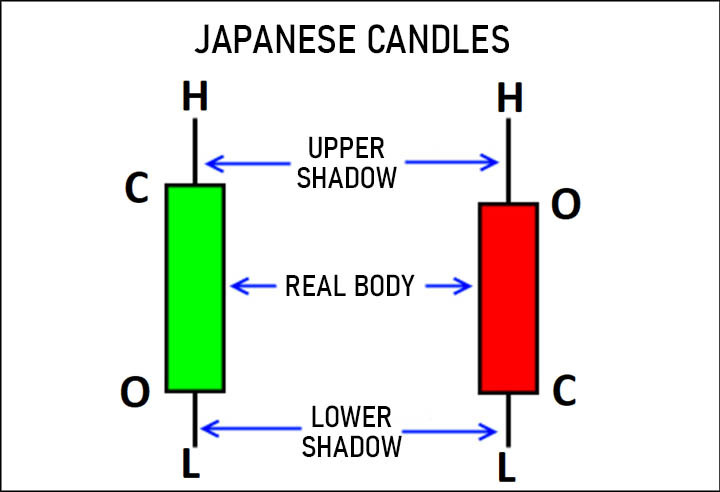
1. Open: The price of the instrument at the beginning of the period.
2. High: The maximum price reached during the period.
3. Low: The minimum price reached during the period.
4. Close: The price of the instrument at the end of the period.
5. Volume: The volume traded during the period.
As a result, a Japanese candle is formed, showing the fundamental four indicators (OHLC) for the selected time interval.
If the candle is green, it means the close was above the open. This indicates a rising candle, and the price during the period increased compared to what it was.
If the candle is red, it means the close was below the open. This indicates a falling candle, and the price during the period decreased compared to what it was.
In conclusion, you see a candlestick chart in your terminal:
3. Class Candle. How Does the Candle Look in OsEngine?
Each candle from the above chart, when entering OsEngine, is transformed into a Candle class. Alternatively, OsEngine also collects these candles from the trade feed.
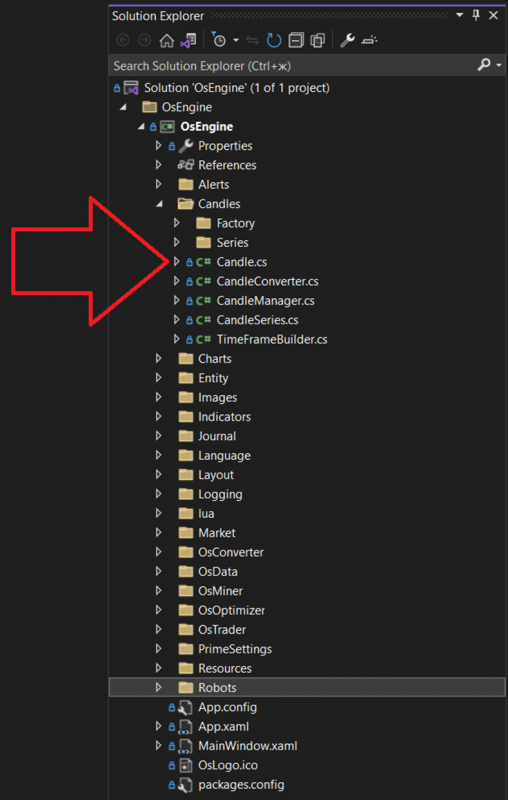
In the OsEngine project on GitHub, this class can be found here.
Inside the project, it is located here:
The class itself, if you open it, looks as follows:
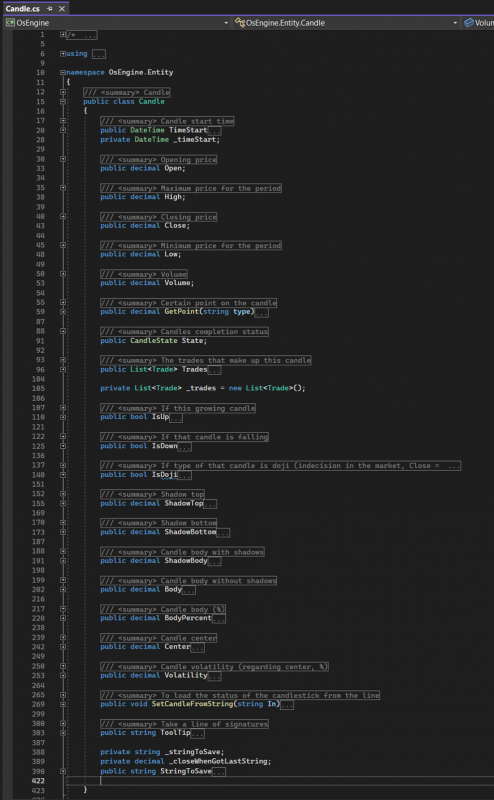
- TimeStart – a public property of type DateTime. A timestamp indicating the start time of the candle.
- Open – a public decimal field that stores the opening price of the candle.
- High – a public decimal field that stores the highest price reached during the candle.
- Close – a public decimal field that stores the closing price of the candle.
- Low – a public decimal field that stores the lowest price reached during the candle.
- Volume – a public decimal field that stores the volume traded within the candle.
- State – a public field of type CandleState. Contains information about the current state of the candle. Possible values include:
- Finished – the candle is a completed object.
- Started – the object has been created and is in the process of formation.
- None – the state is undefined.
- GetPoint – a public method that takes a string as a parameter representing the type of requested data. Allowable strings include: "Close," "High," "Low," "Open," "Median," "Typical." The method returns the corresponding value of the candle.
- Trades – a public property that returns a list of all trades executed within this candle.
- IsUp – a public boolean property. Indicates whether the candle is rising. If the candle's closing price is greater than its opening price, it returns true. Otherwise, it returns false.
- IsDown – Public Property of Type Bool. Indicates whether the candle is bearish. If the closing price of the candle is lower than the opening price, it returns true; otherwise, it returns false.
- IsDoji – Public Property of Type Bool. Indicates whether the candle is a doji. If the closing price of the candle is equal to the opening price, it returns true; otherwise, it returns false.
- ShadowTop – Public Property of Type Decimal. Returns the size of the upper shadow of the candle.
- ShadowBottom – Public Property of Type Decimal. Returns the size of the lower shadow of the candle.
- ShadowBody – Public Property of Type Decimal. Returns the total size of the candle, including the shadows.
- Body – Public Property of Type Decimal. Returns the size of the candle's body from opening to closing.
- BodyPercent – Public Property of Type Decimal. Returns the size of the candle’s body as a percentage of the opening price.
- Center – Public Property of Type Decimal. Returns the mid-price of the candle.
- Volatility – Public Property of Type Decimal. Calculates and returns the volatility value of the candle.
- SetCandleFromString - a public method that accepts a string containing data for all fields, parses it, and initializes the object's state.
- ToolTip - a public property of type string that constructs a string representation of the candle to be displayed as tooltip information on the chart when hovered over with the mouse.
- StringToSave - a public property of type string that constructs a string representation of the candle for later storage.
4. How Can Candles Be Used in Bots on OsEngine?
Most of the robots in the public examples of OsEngine use candles in one way or another as signals for entering or exiting positions.
Below are links to examples of ready-made robots:
1. Three Soldiers – A classic and very simple example.
2. Three Soldiers and Three Crows – Adapting to averaged intraday volatility.
4. Pump-Dump Detector – Identifying rapid market movements through the analysis of unusual candle series.
Regarding how to subscribe to updates for the candle chart in code, in the first example above (Three Soldiers), it is done as follows:
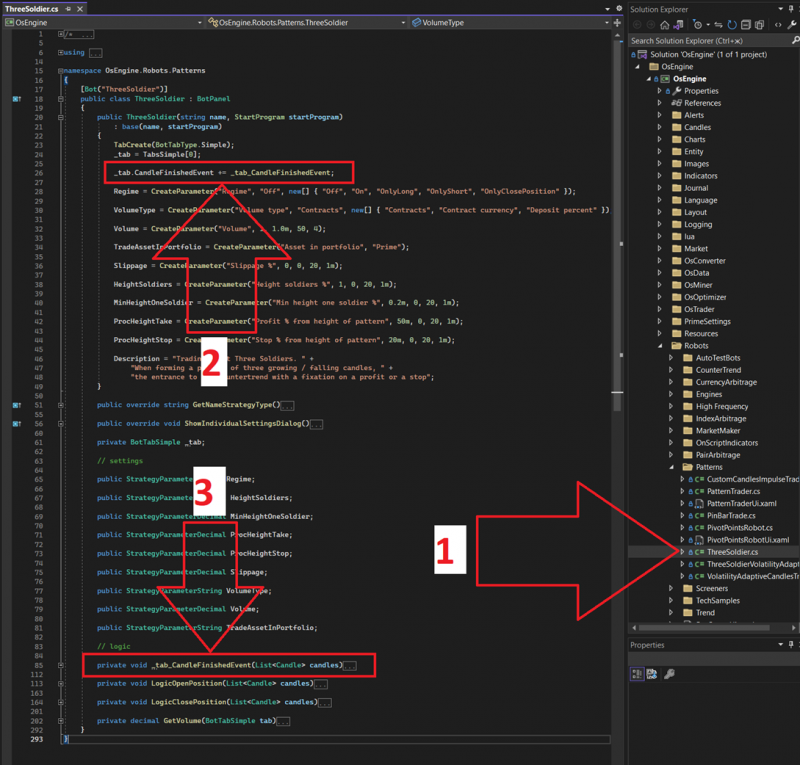
1. Robot ThreeSoldier in the Project.
2. Subscribing to the candle completion event.
3. Candle completion event handler. An array of candles is received here, which can be analyzed in some manner.
Happy coding!
If you have any difficulties or questions, please write to the support chat. Link